


Century 21 People’s Choice Realty Inc., Brokerage
120 MATHESON BLVD E #103
MISSISSAUGA, Ontario
L4Z 1X1


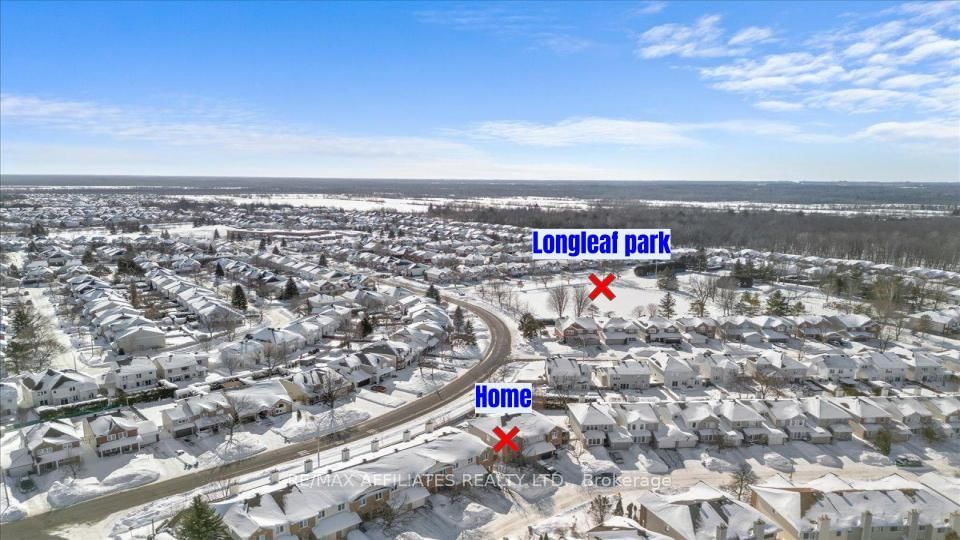

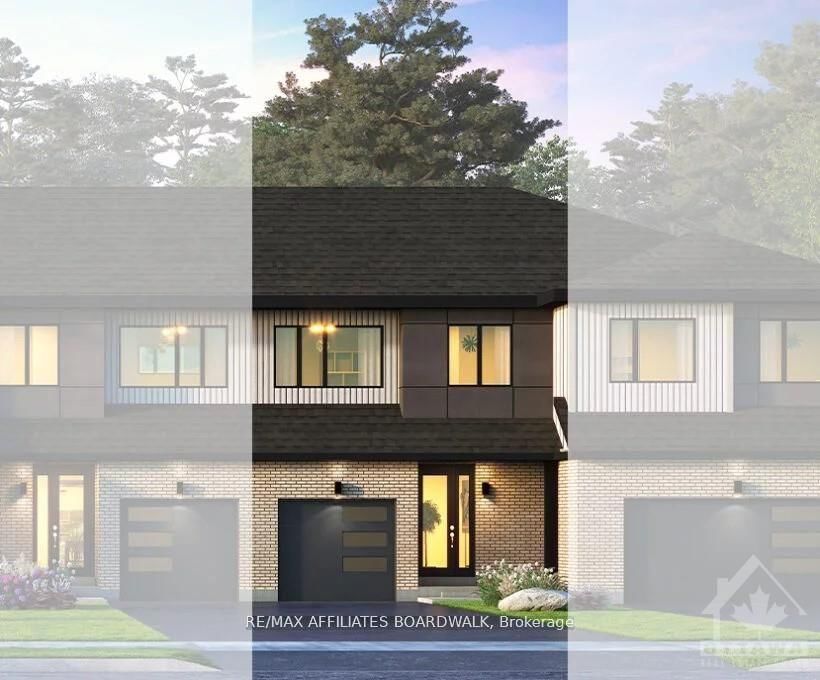
Ottawa, Chapel Hill South - Orleans Village, K1W 1G3
$589,900
Listed by RE/MAX AFFILIATES REALTY LTD..
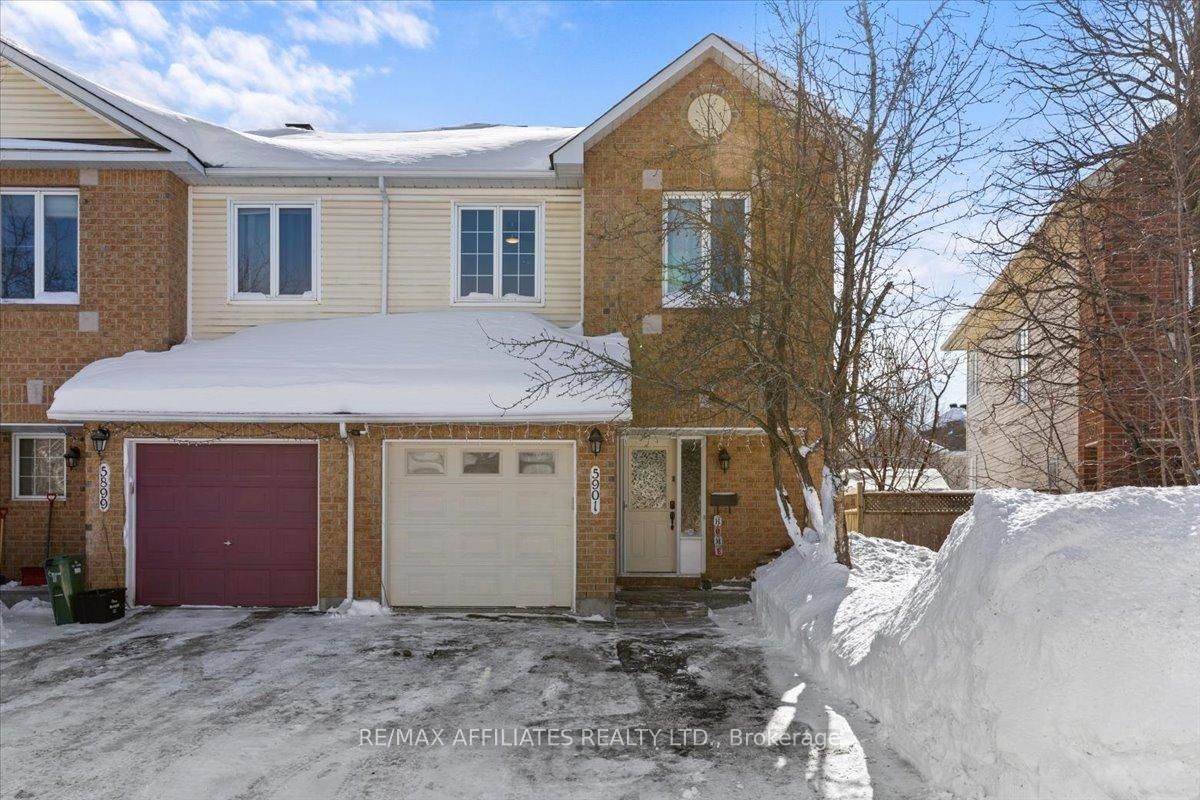
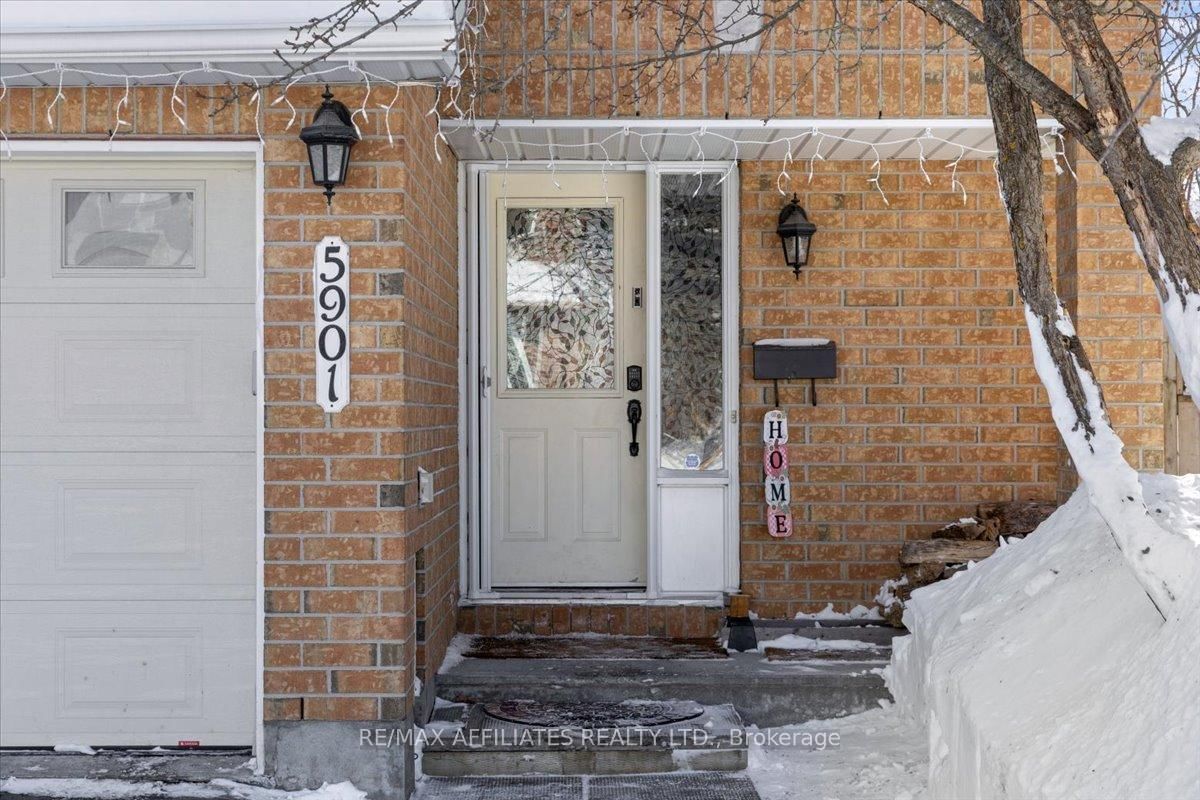
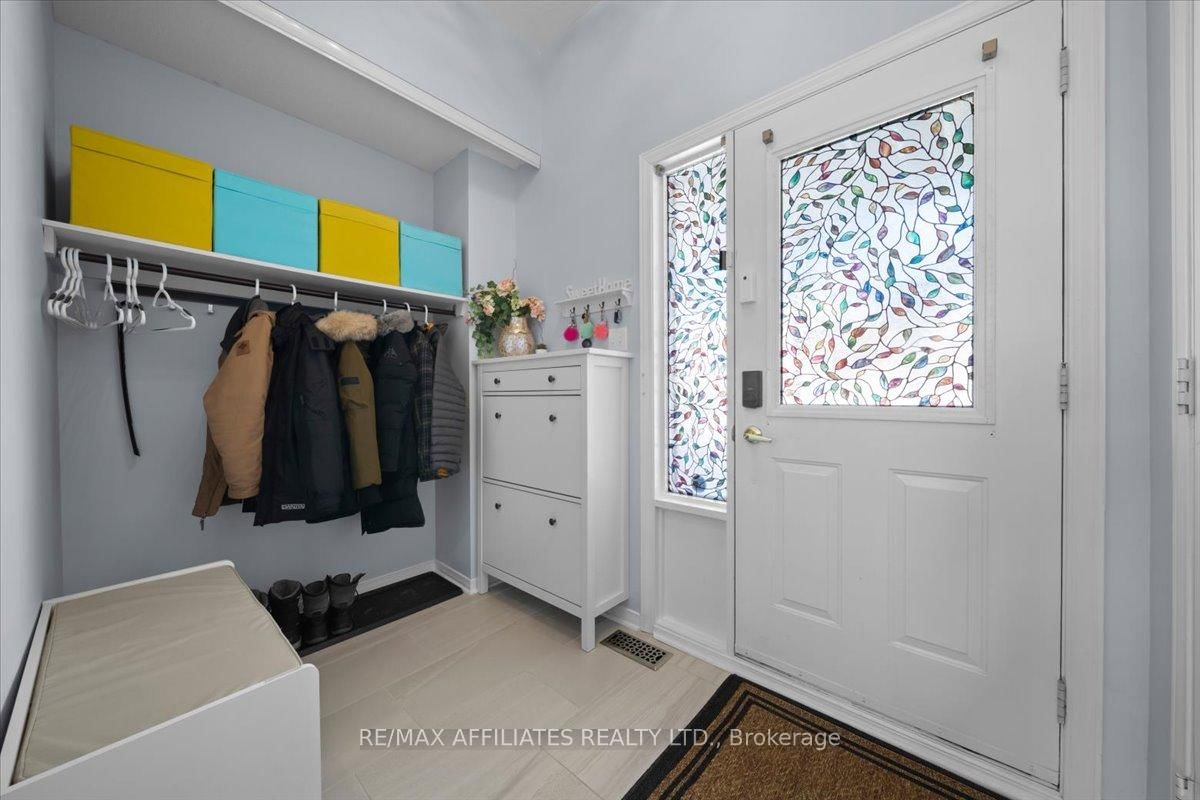
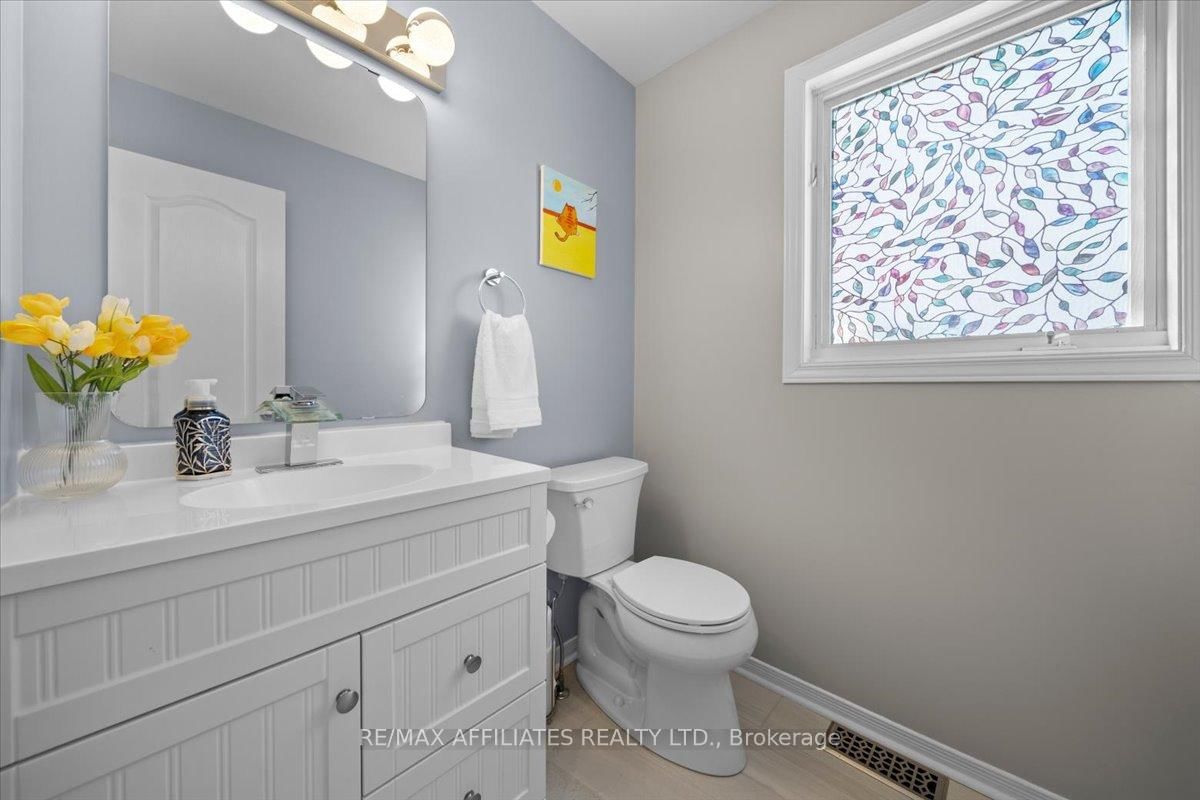
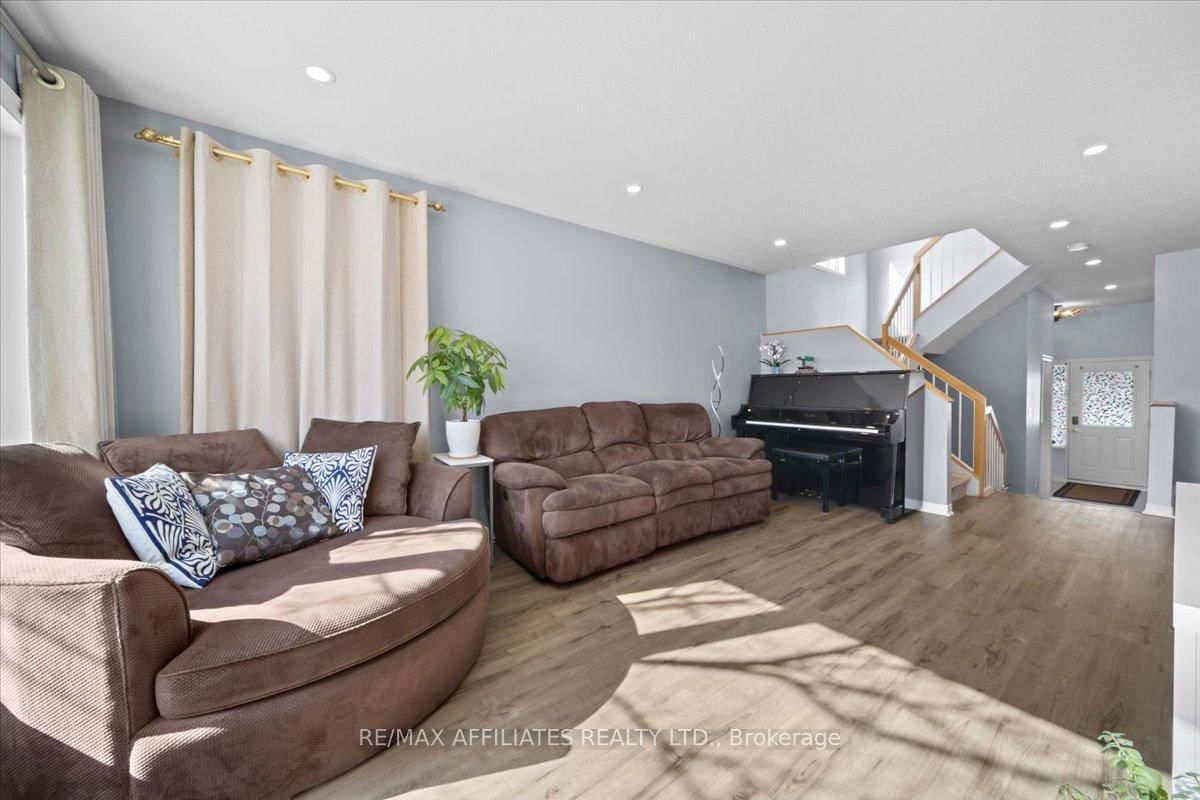
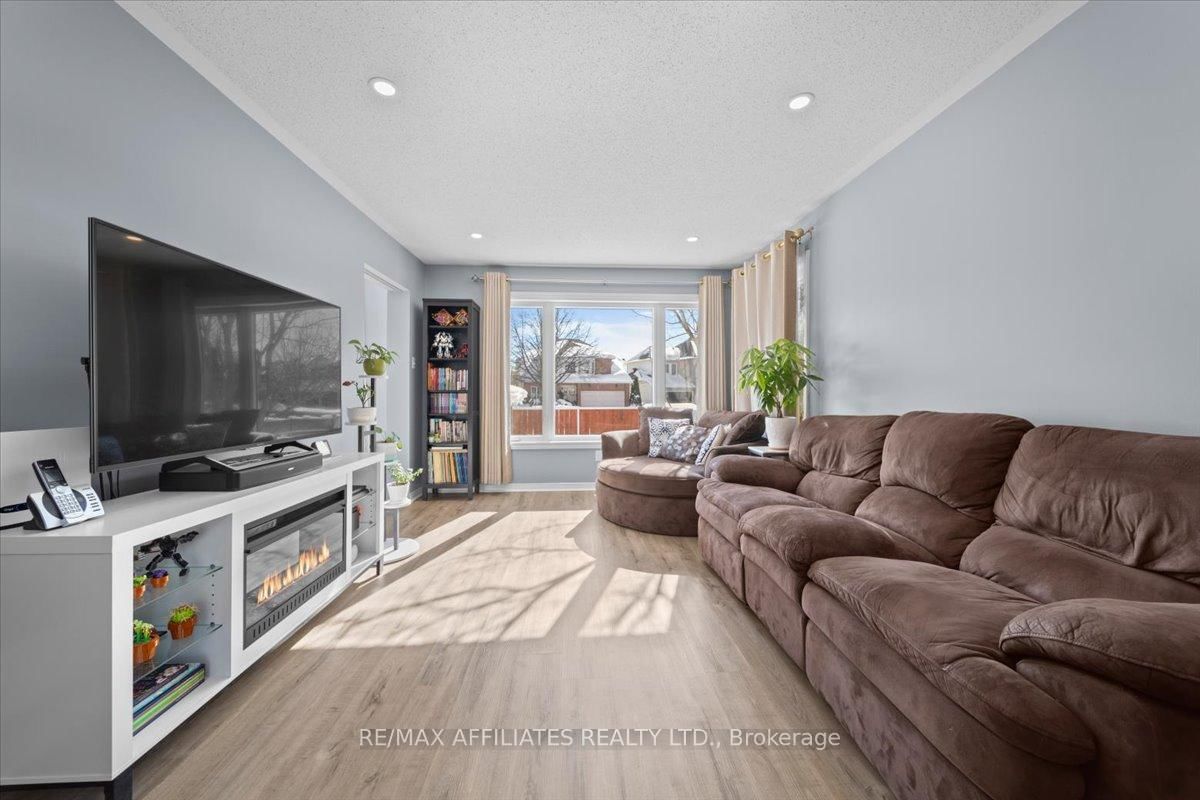
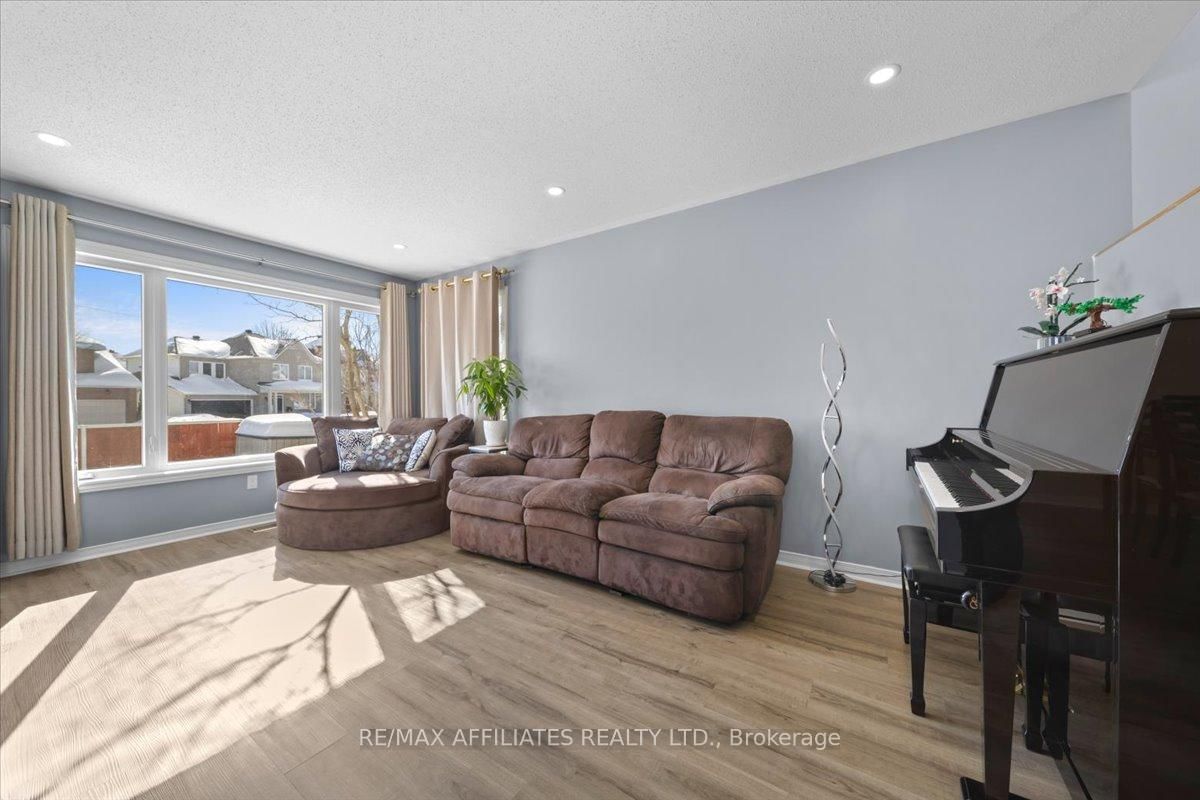
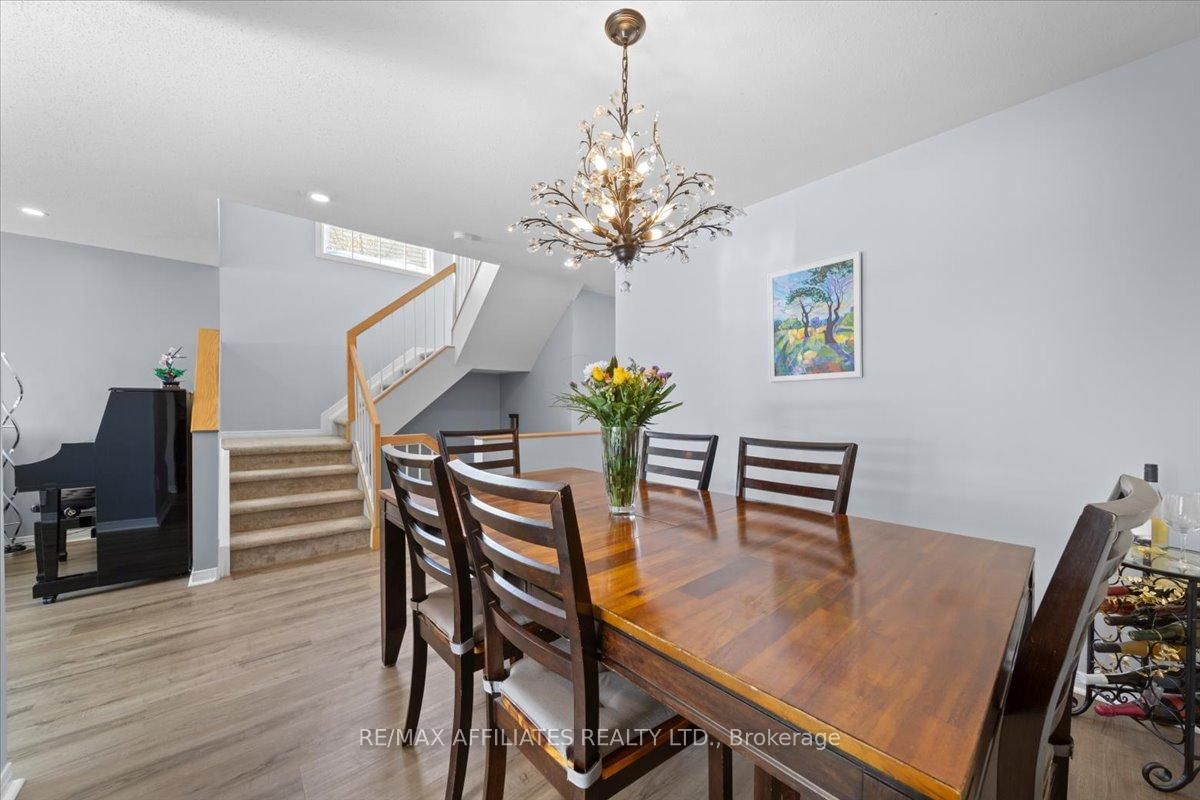
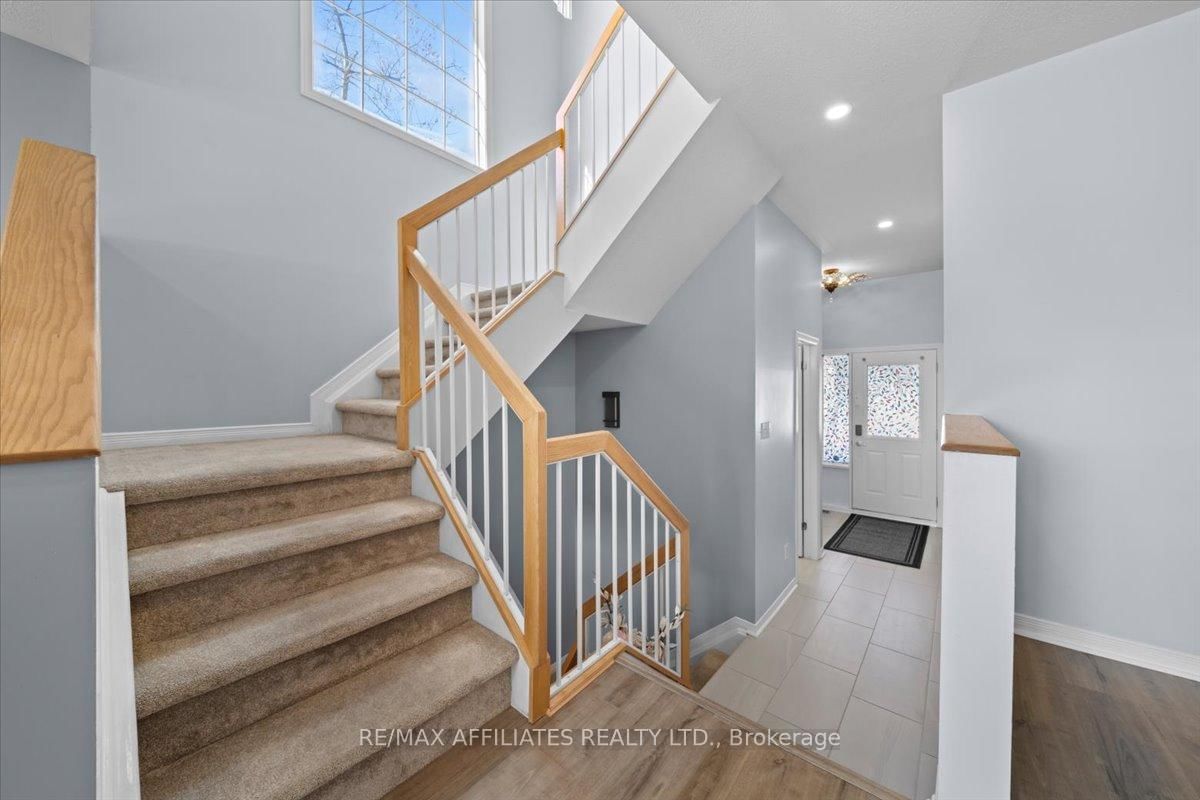
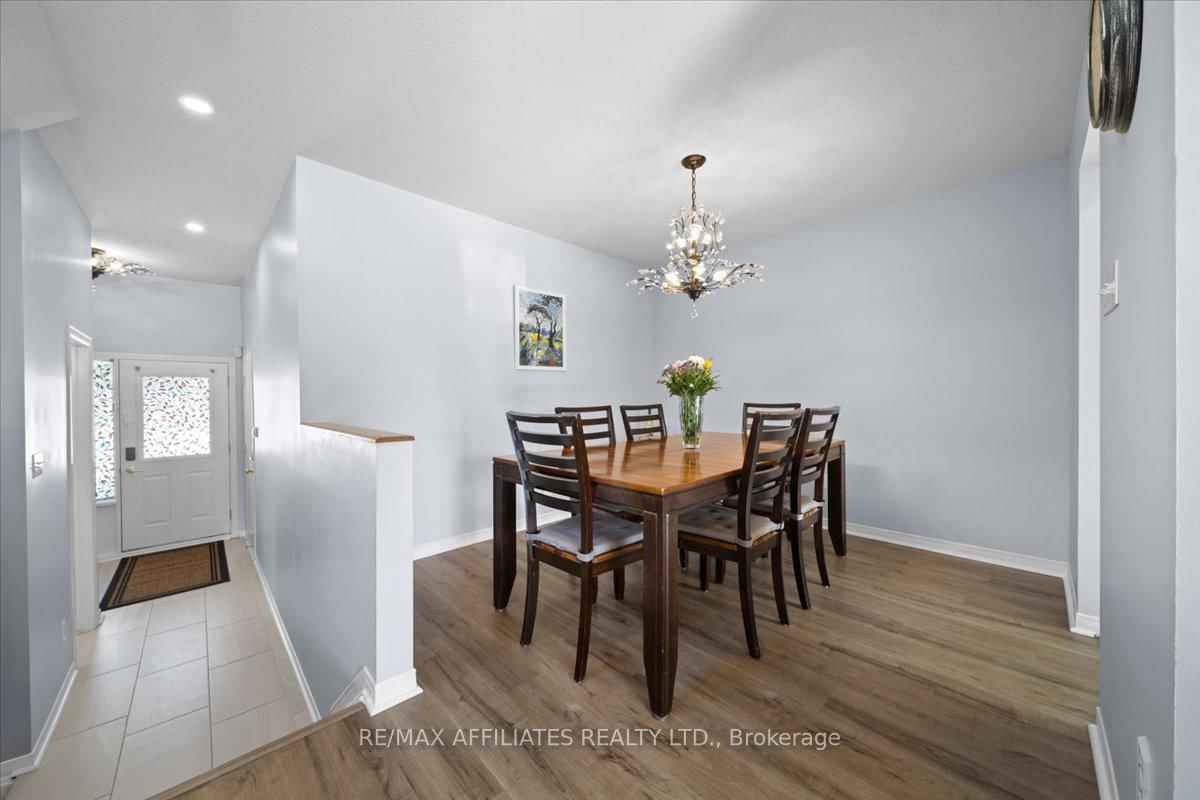
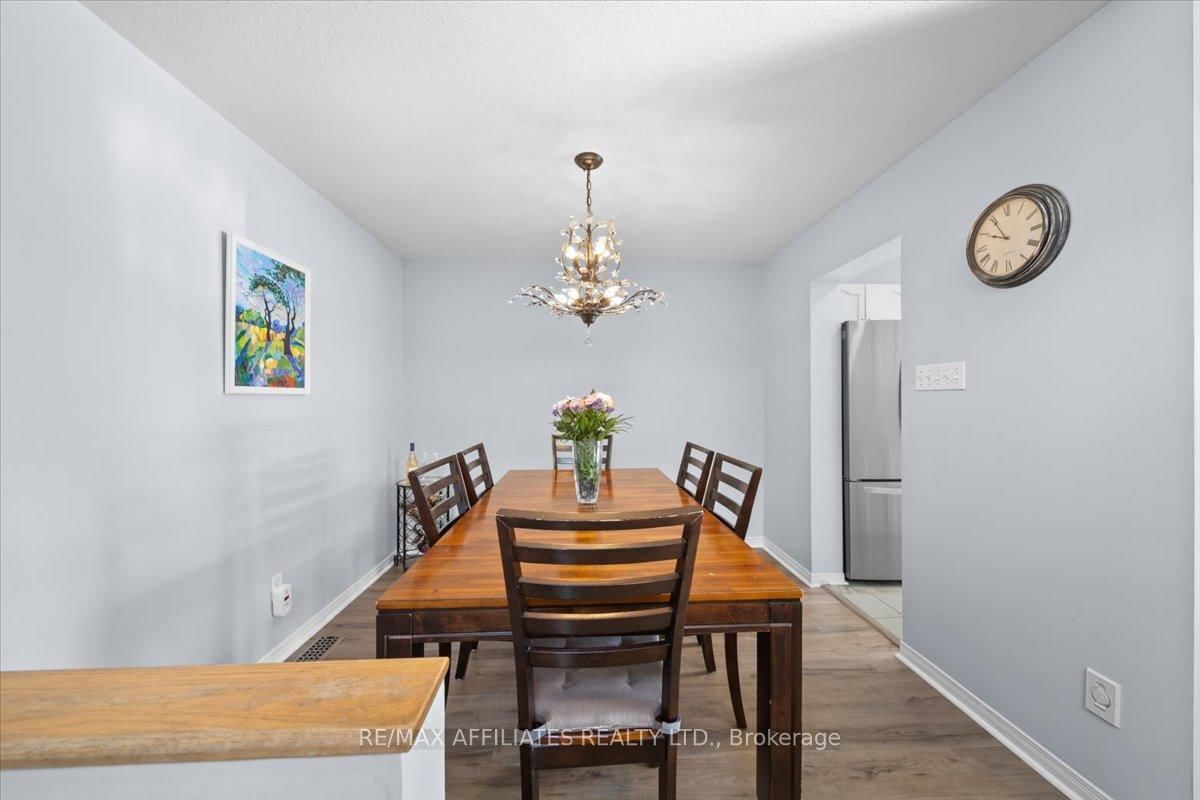
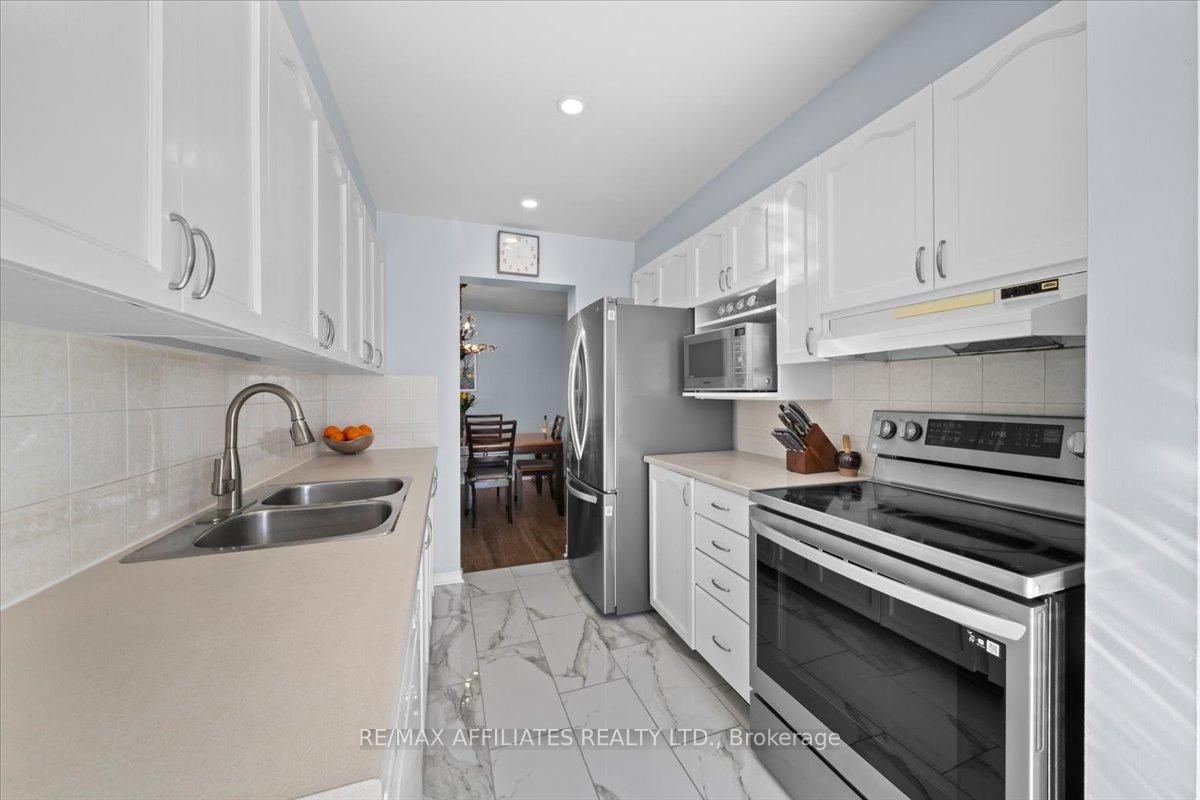
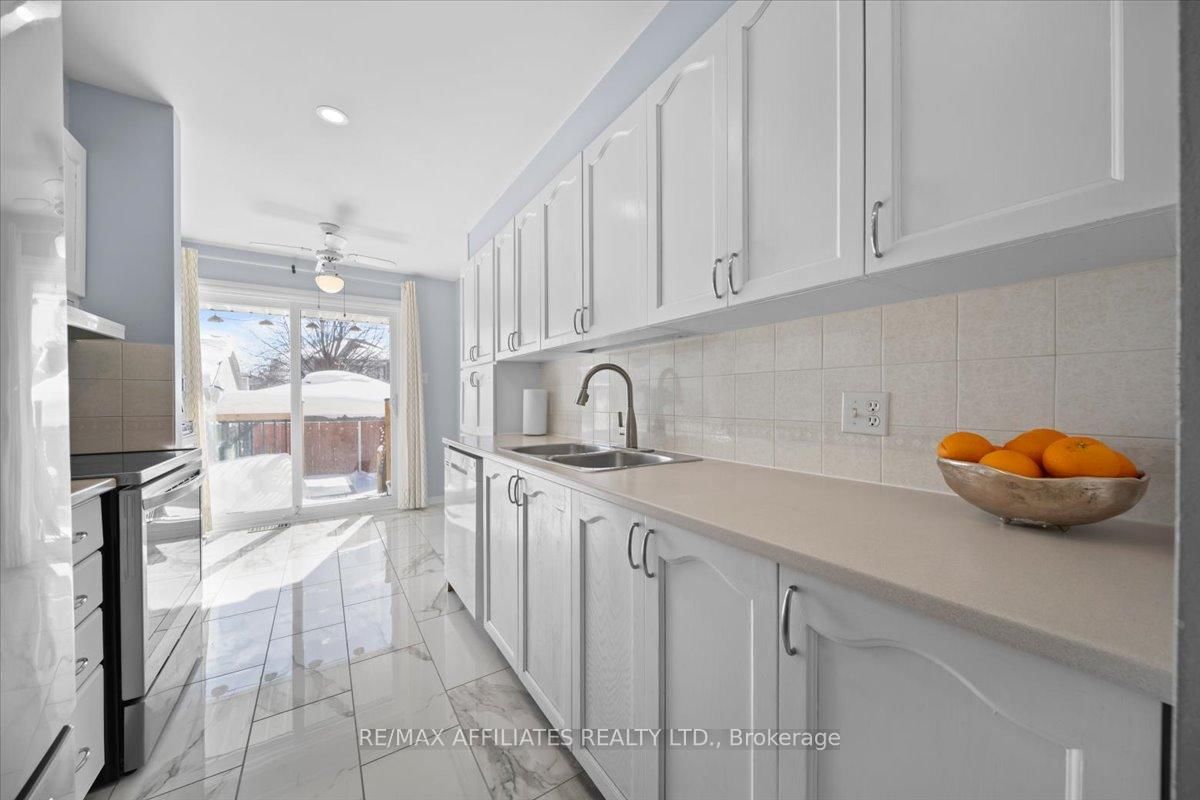
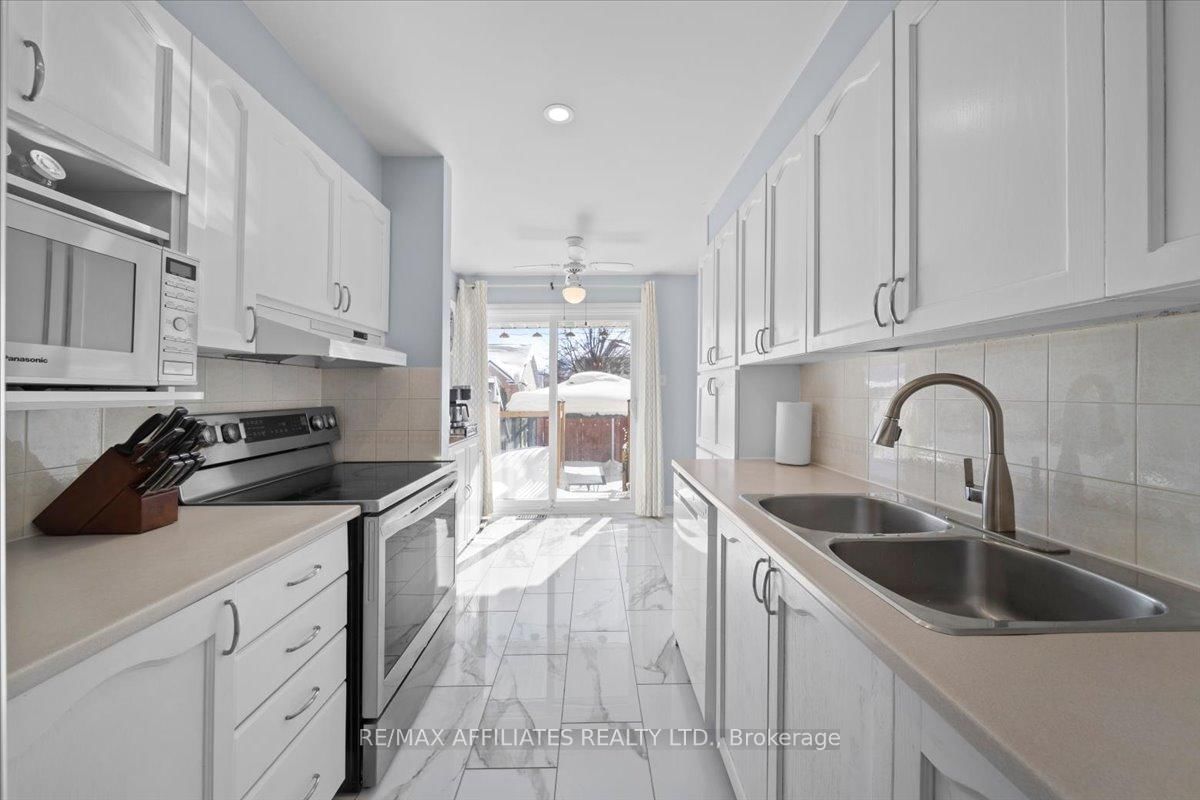
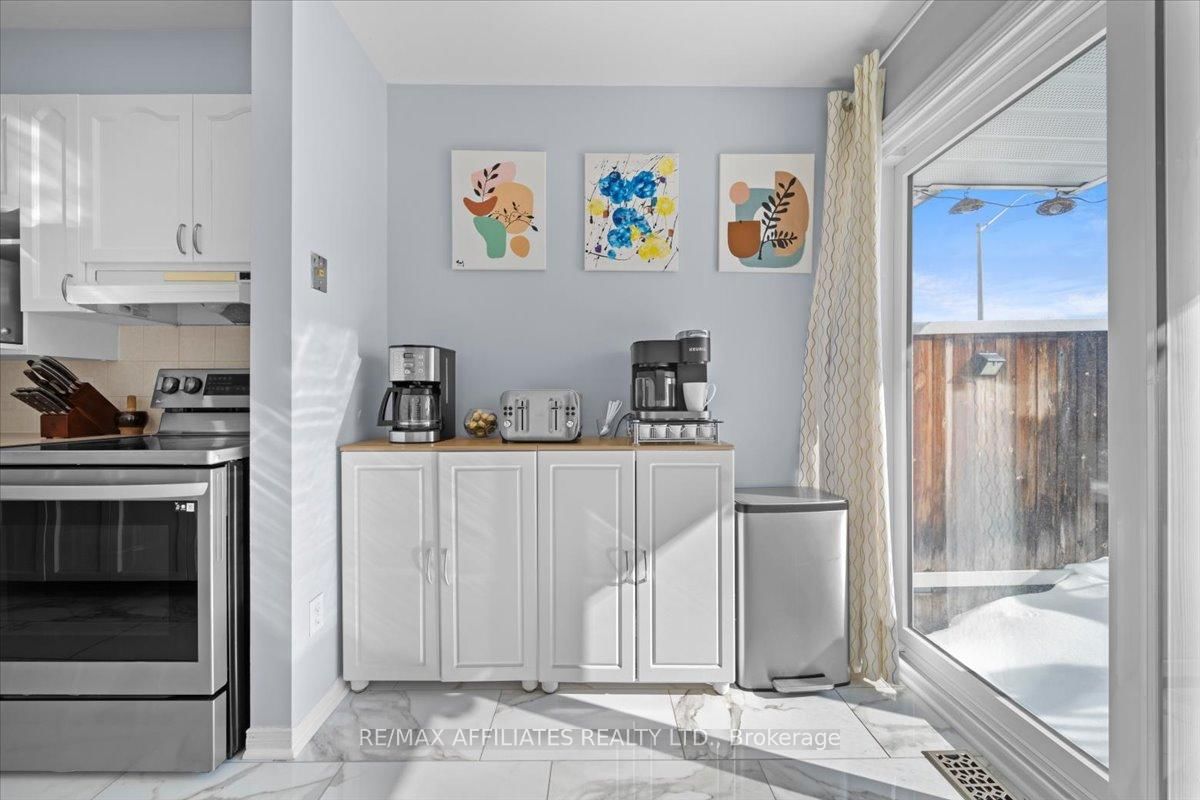
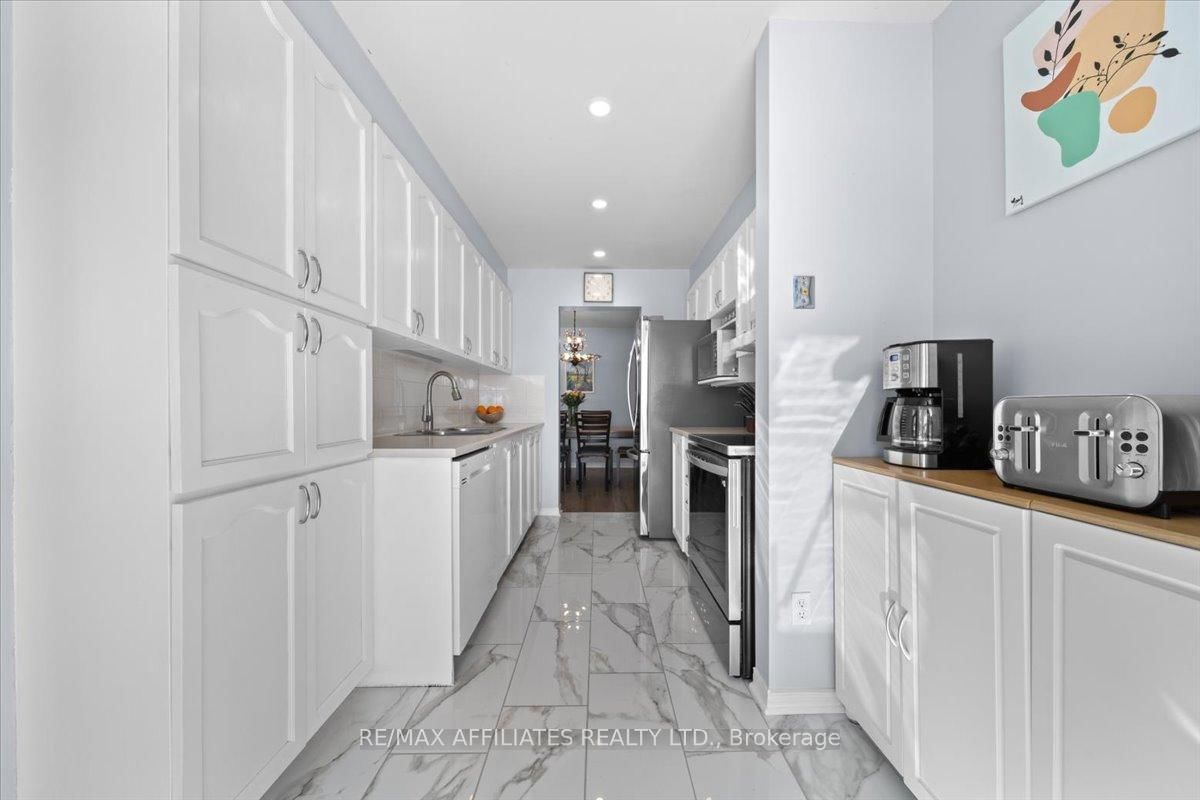
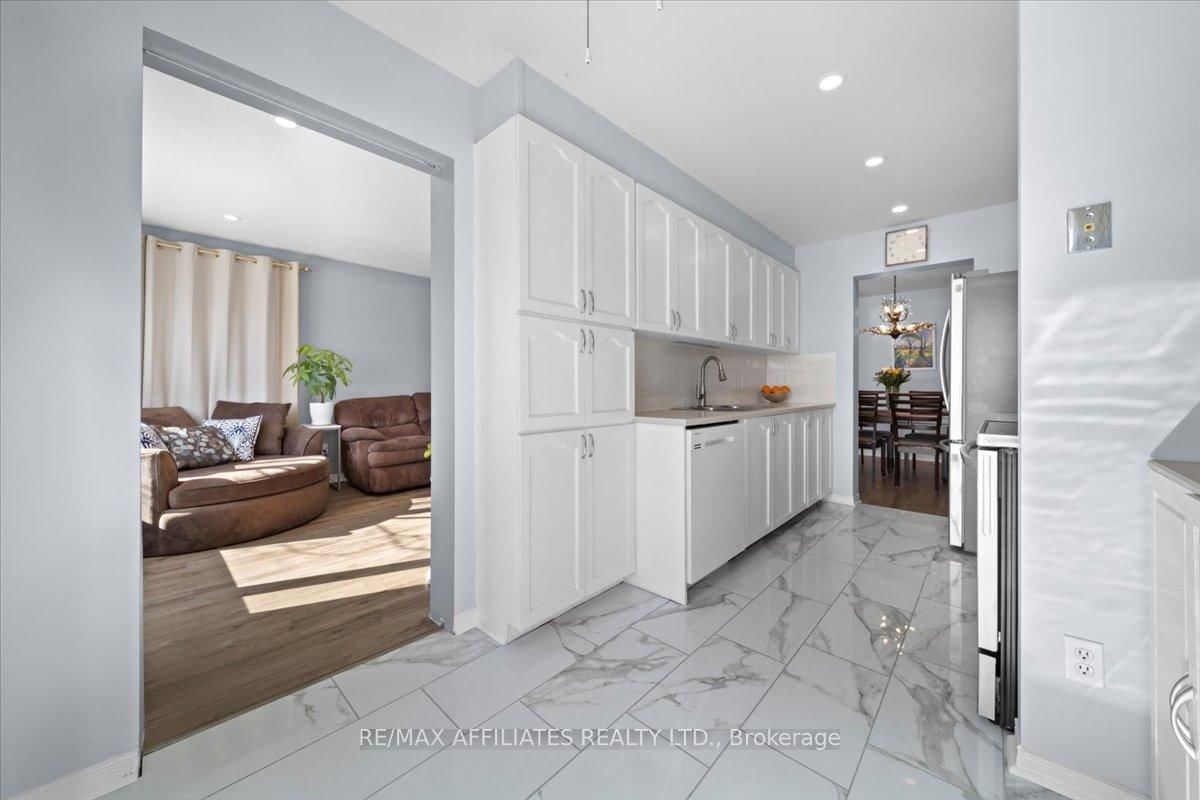
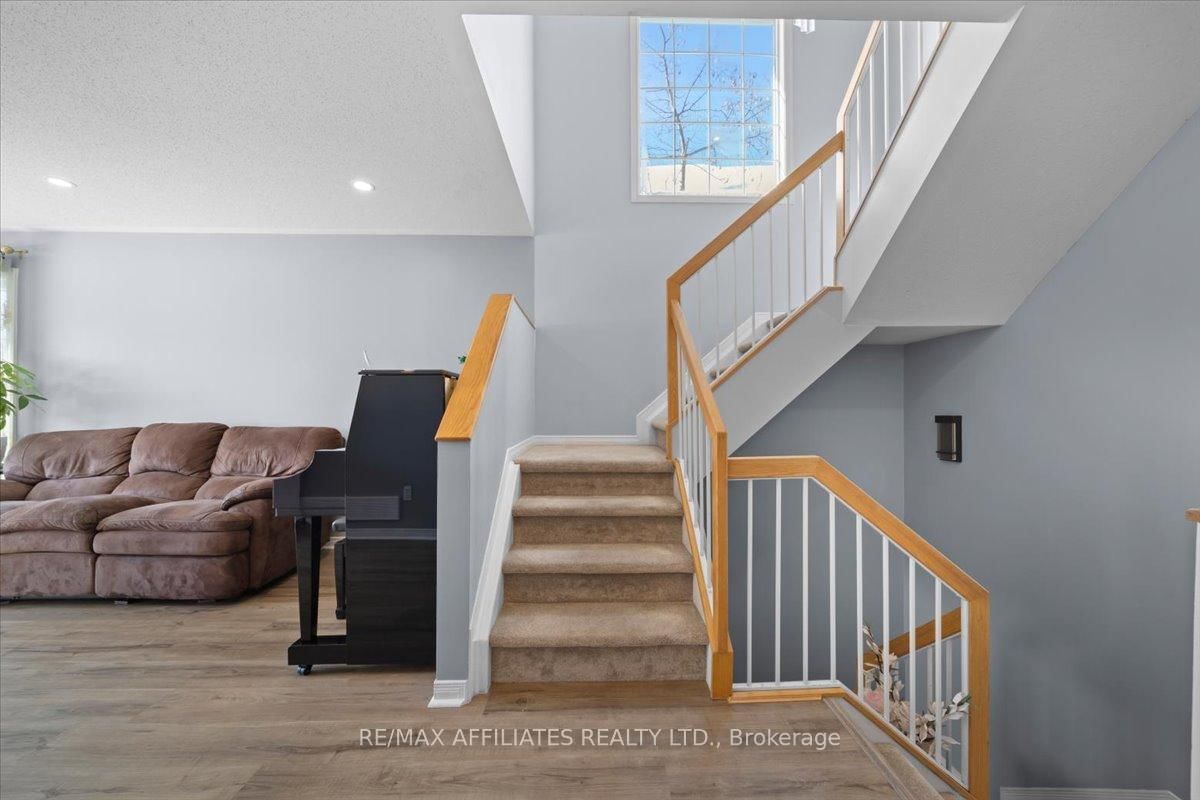
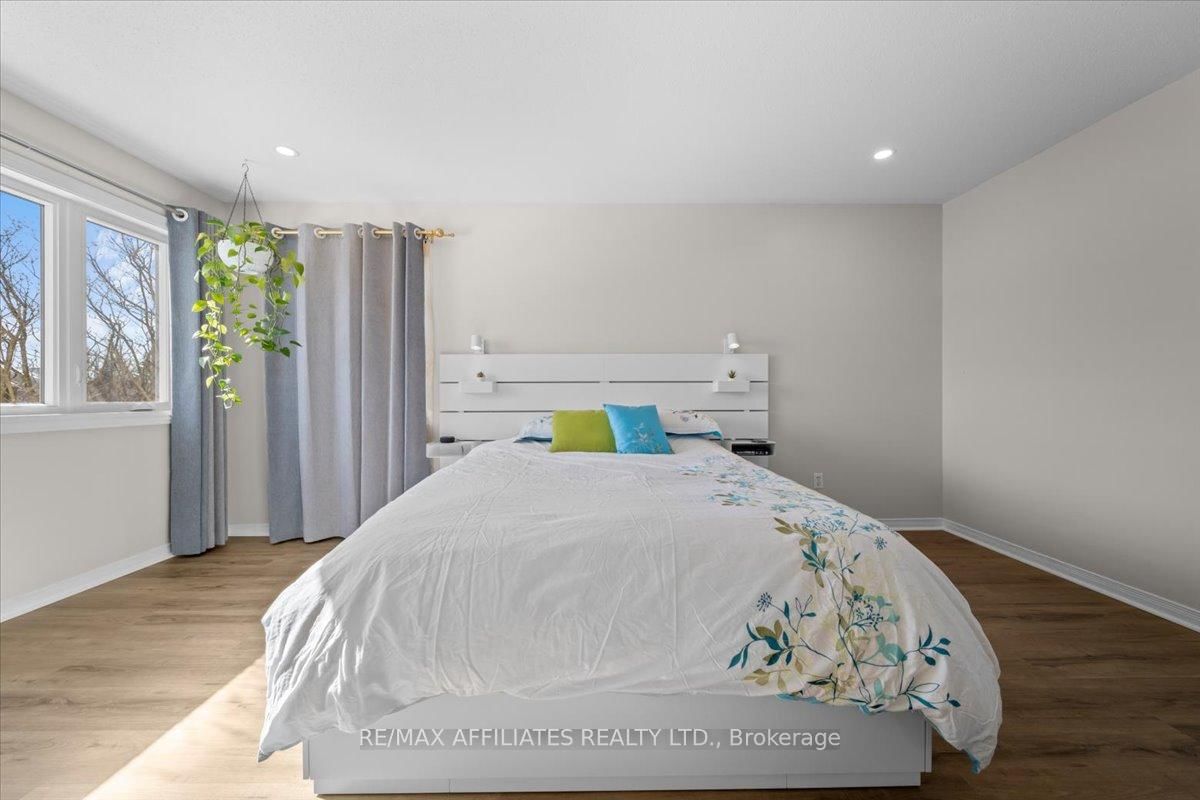
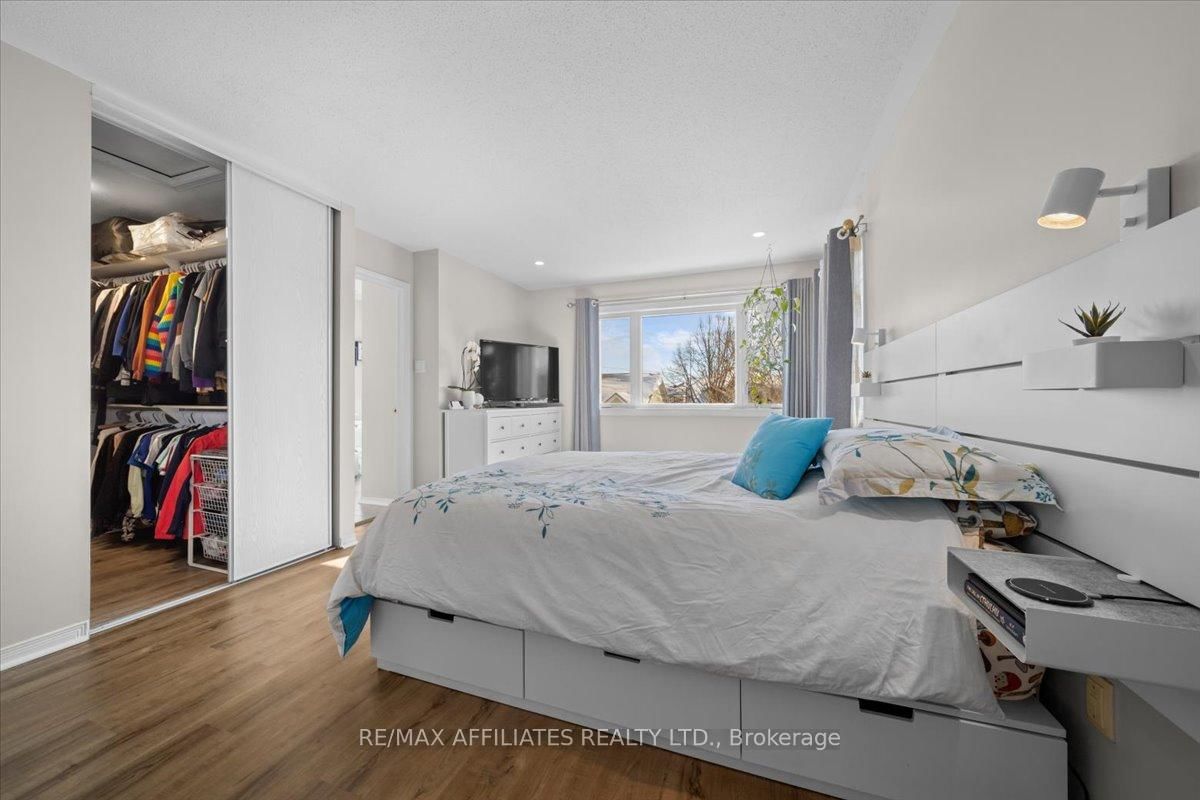
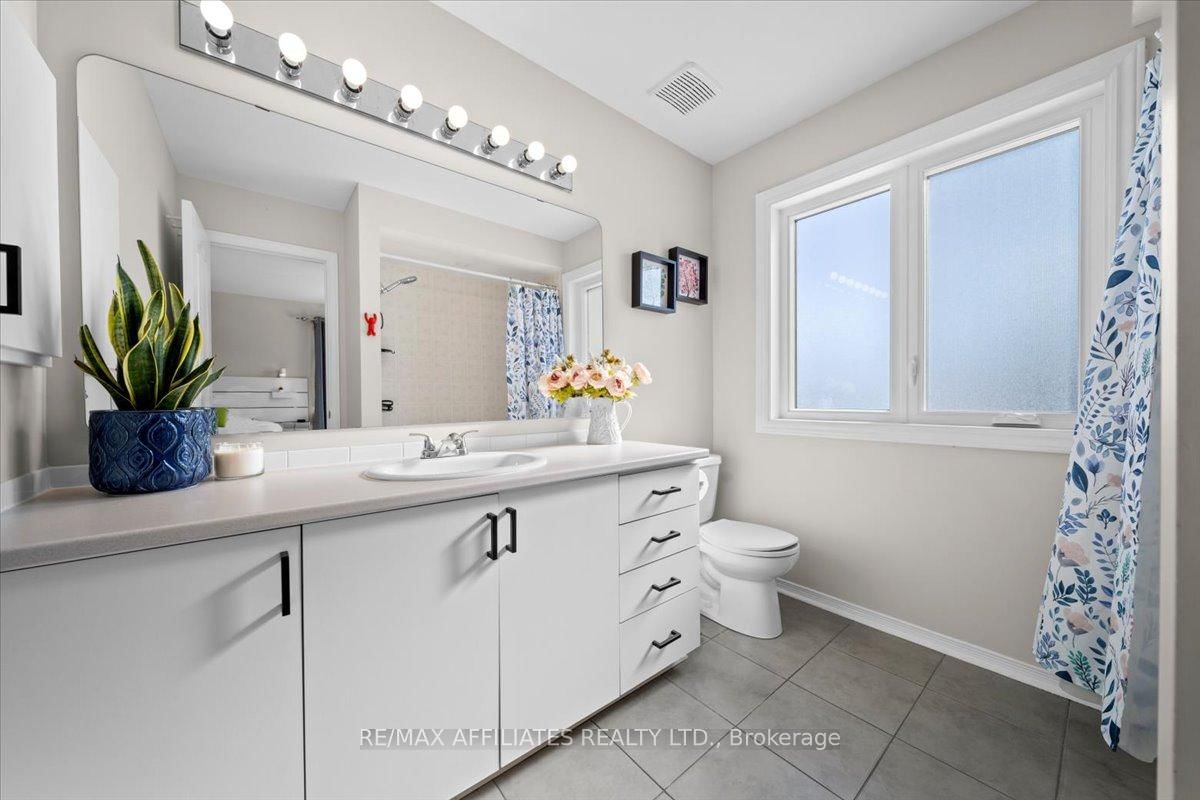
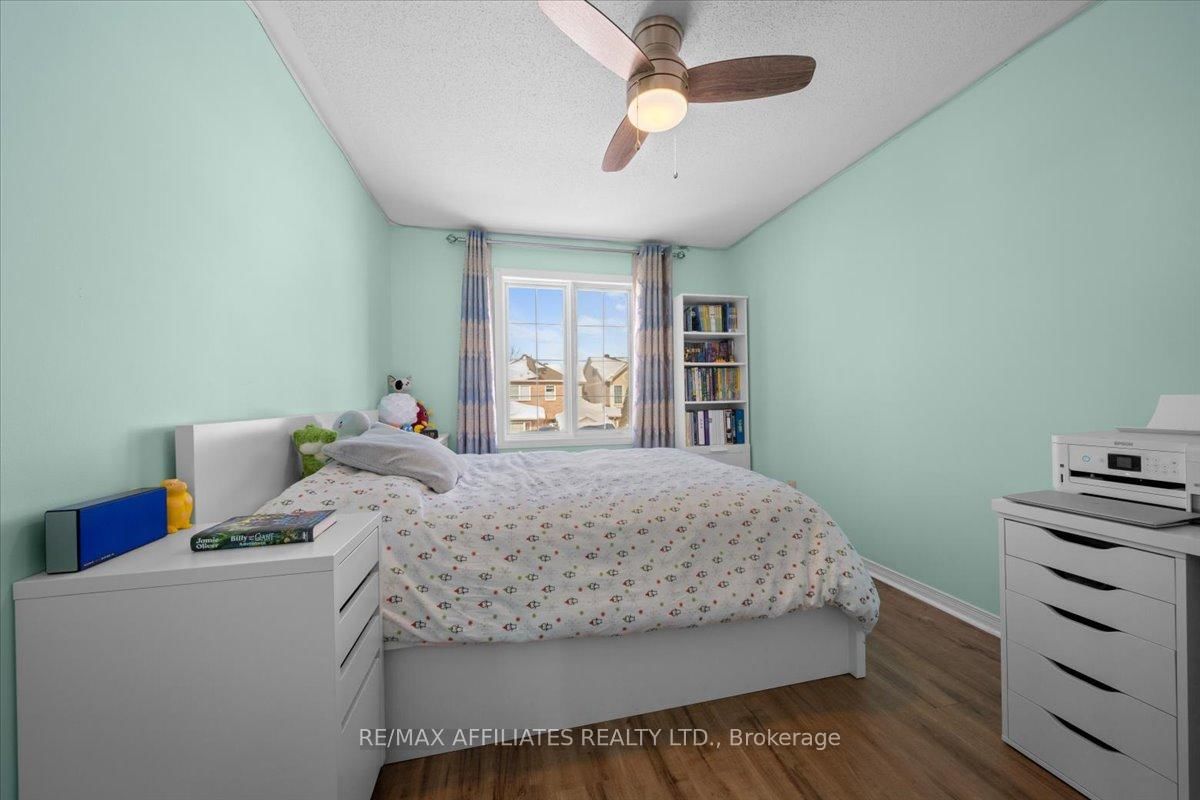
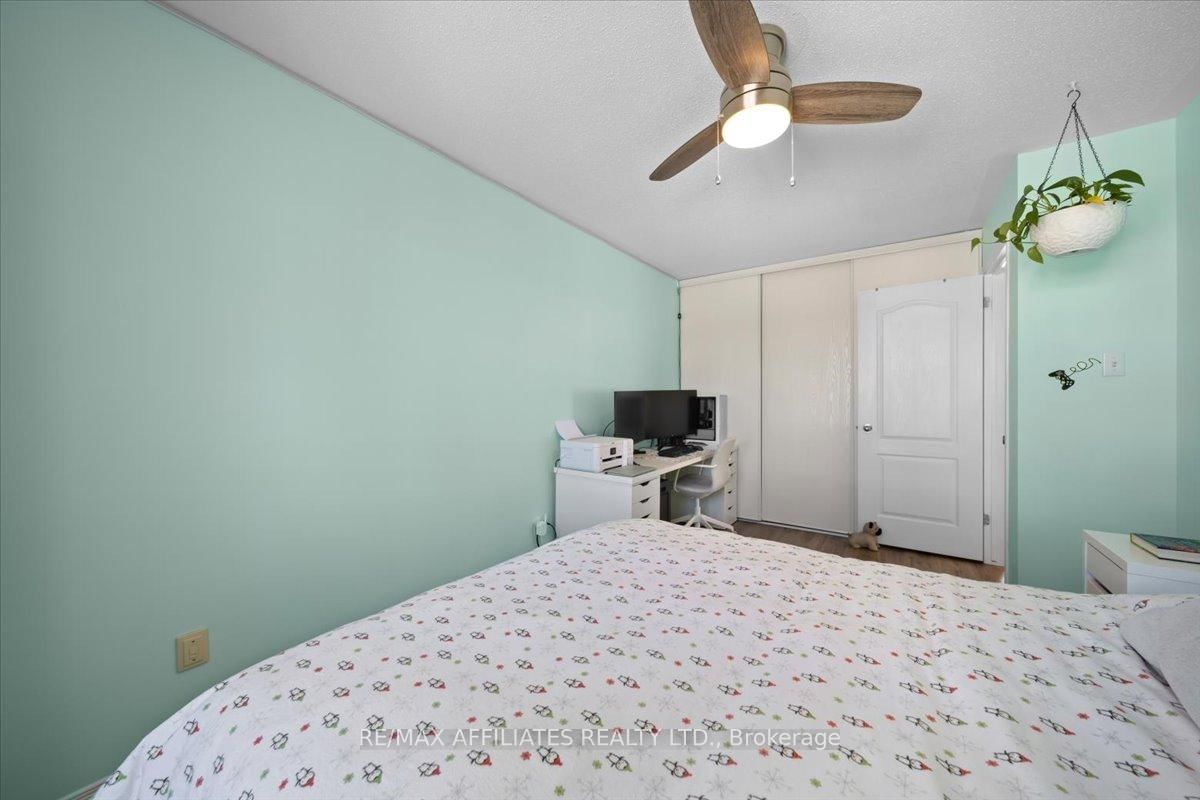
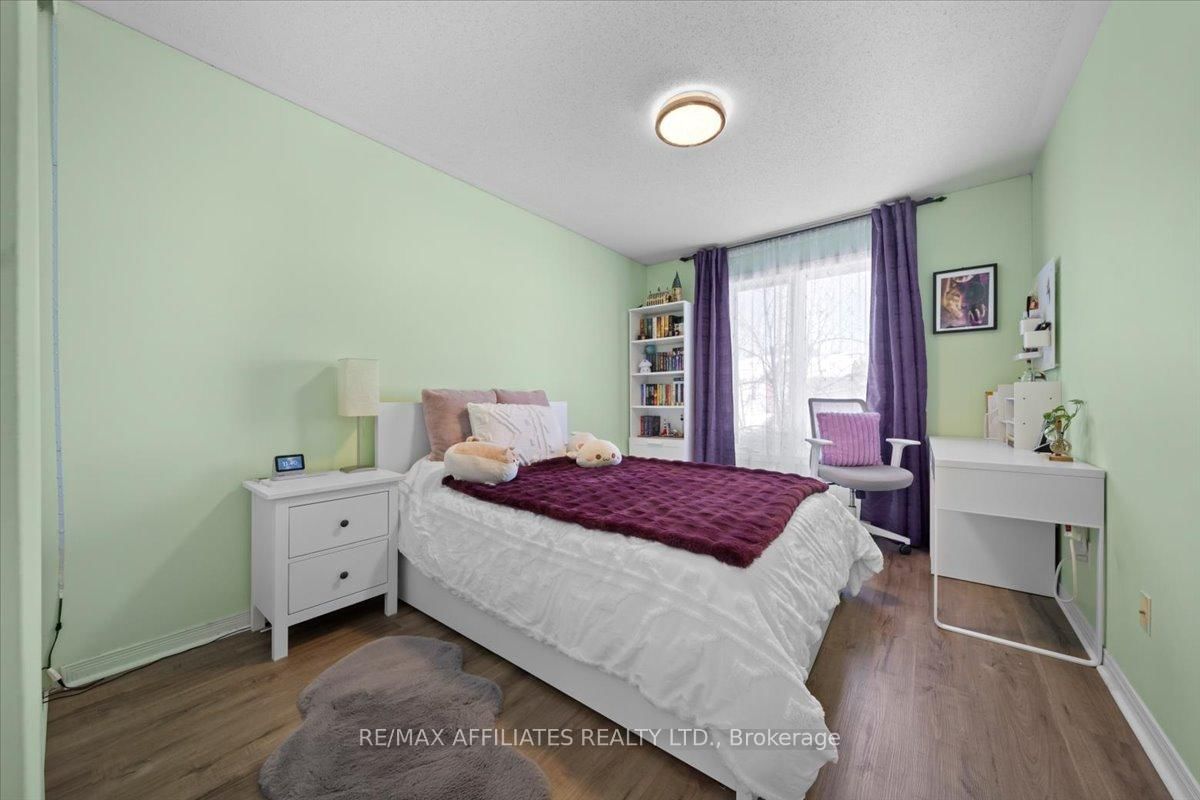
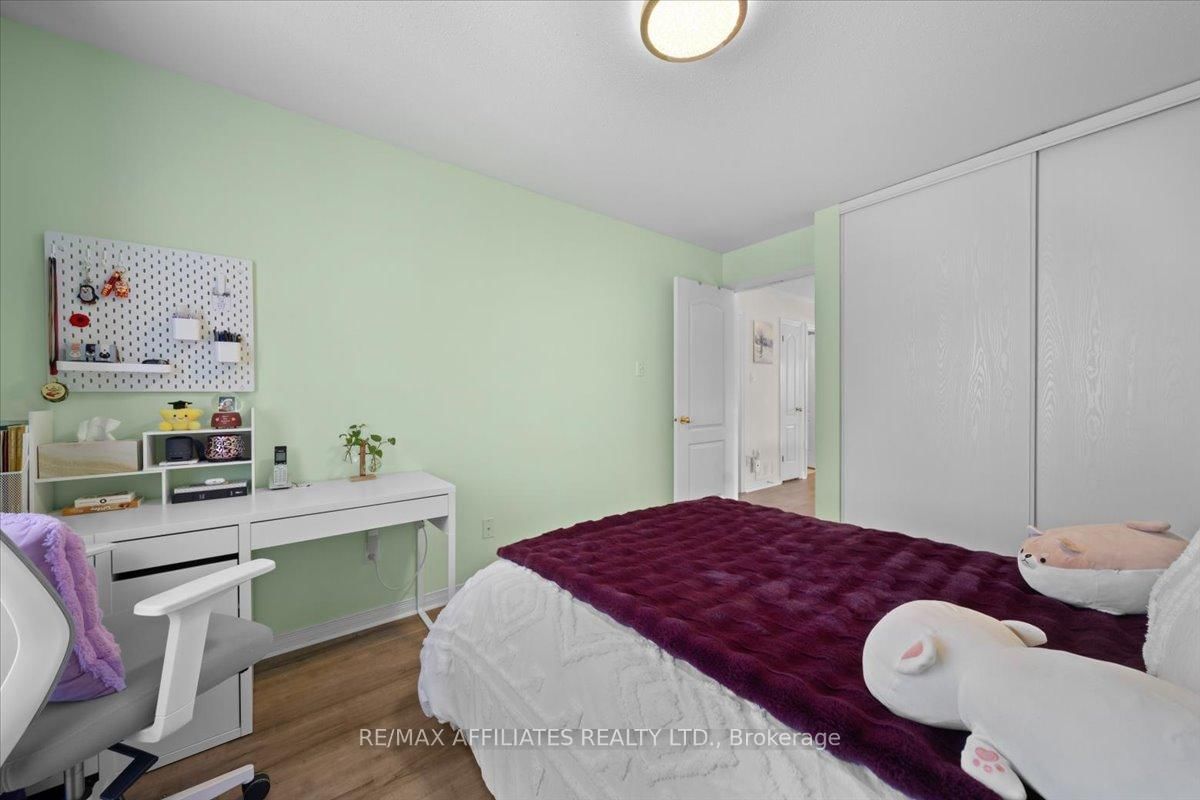
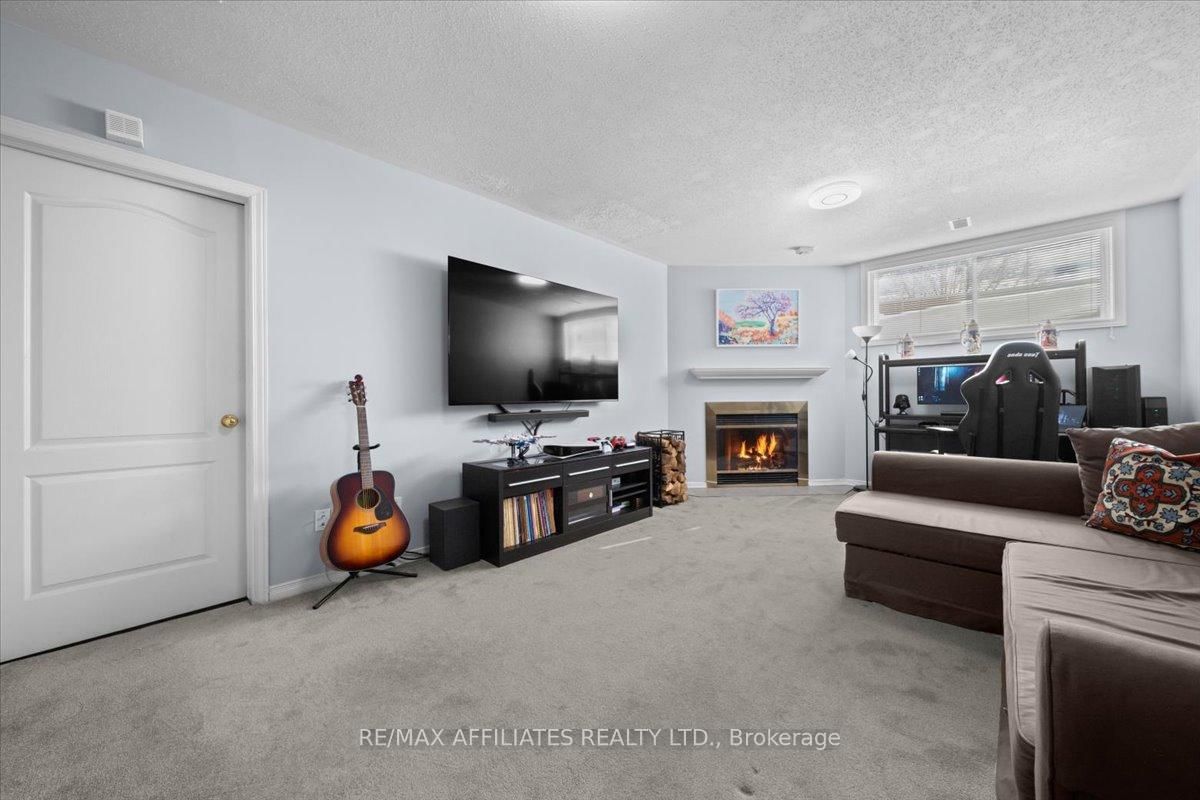
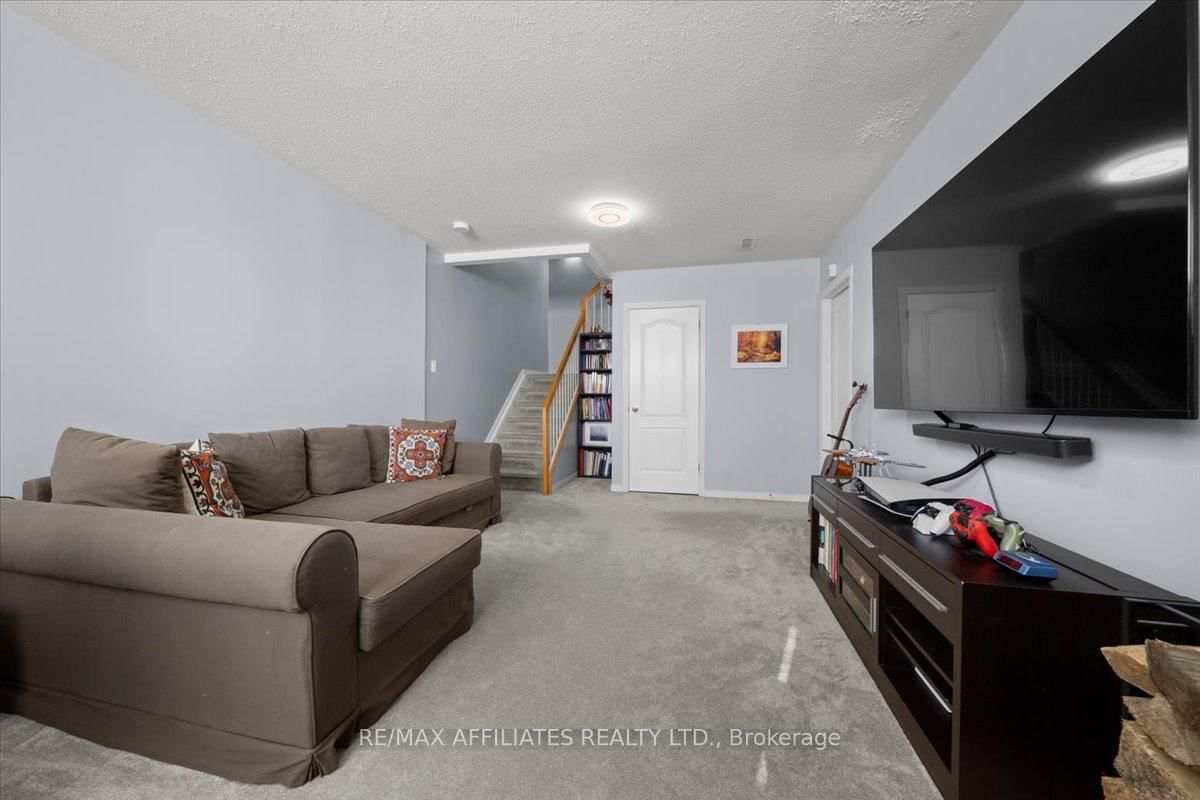
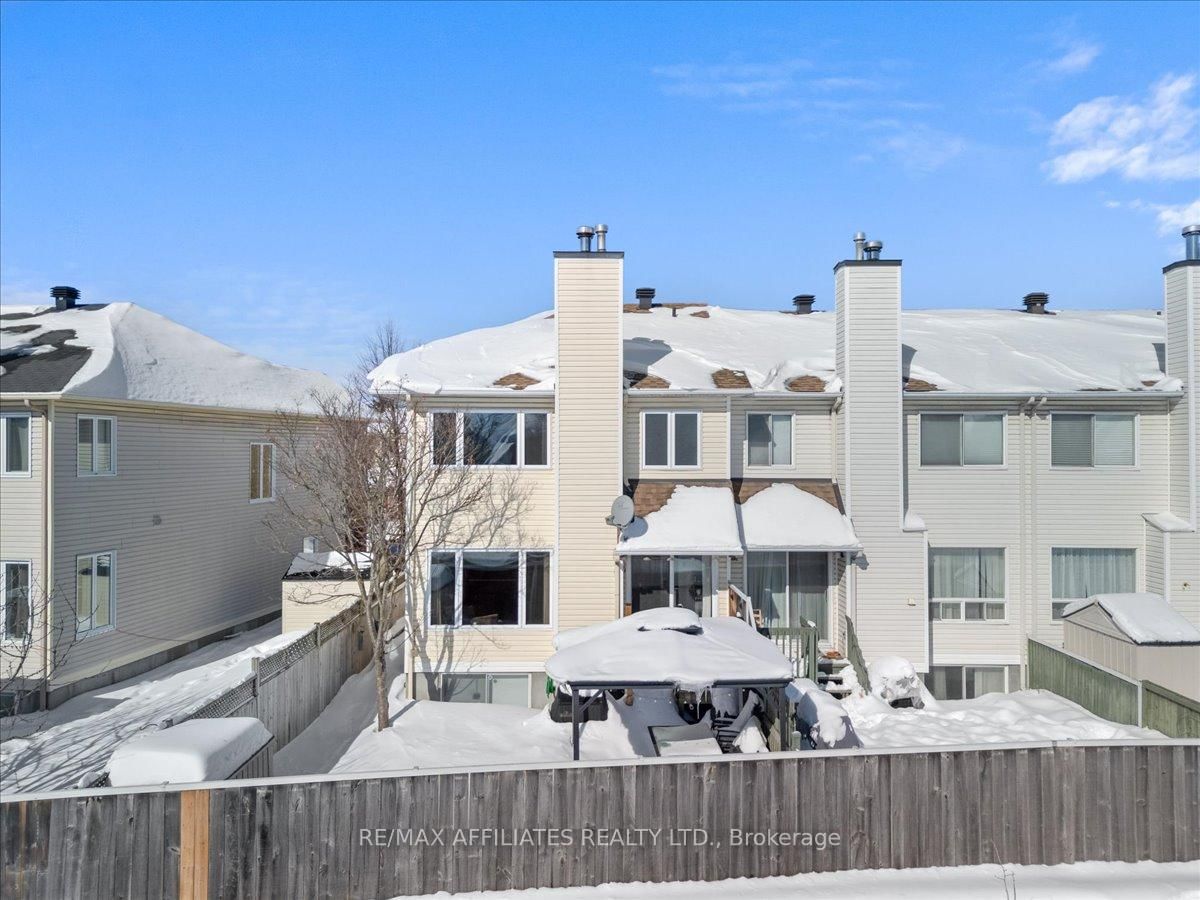
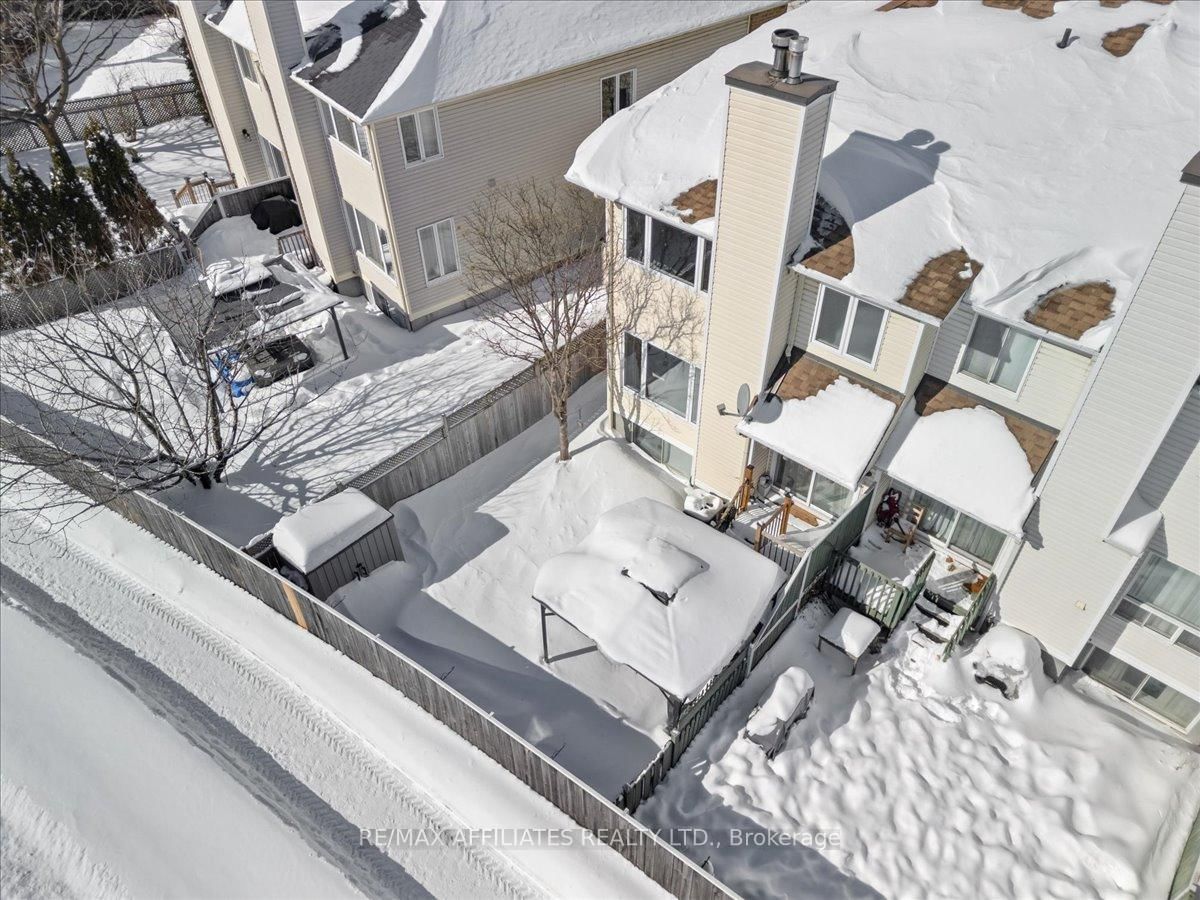
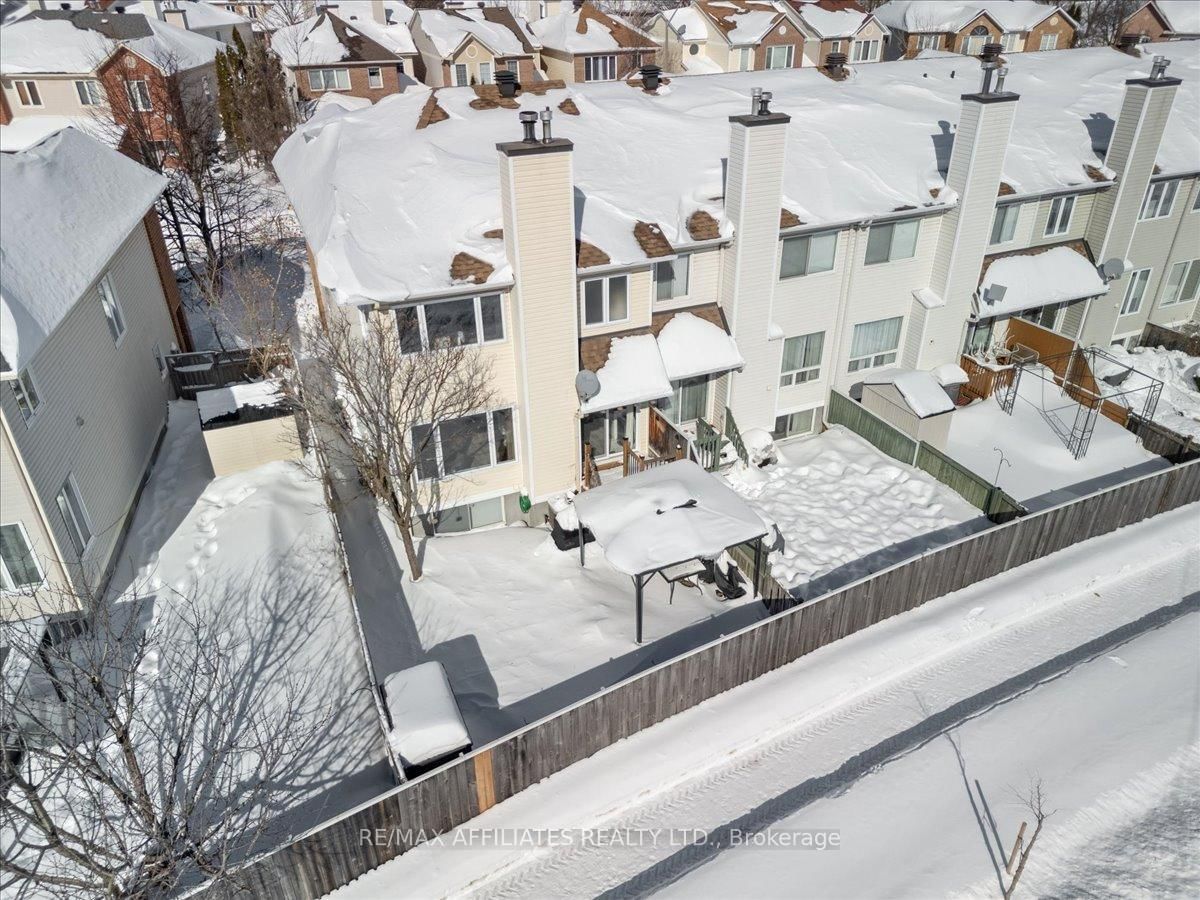
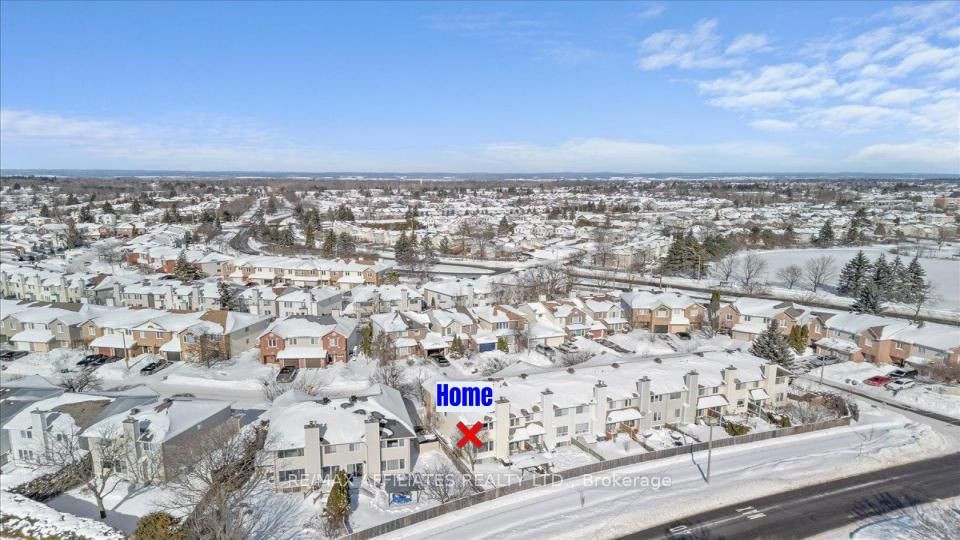
BRIGHT and Updated, END-UNIT with NO REAR NEIGHBORS. low utility costs and an EN SUITE bath! Over 45k of UPGRADES done recently! This home is apx 200+ square feet LARGER (above grade) than similar homes at this price point! That's a LOT OF HOUSE! Located in the sought-after West Orleans neighborhood of CHAPEL HILL SOUTH, making it an easy commute! This home is perfect for families and professionals alike. Enjoy privacy in your fully fenced SOUTH FACING yard with deck, patio and a natural gas BBQ hookup! Spacious parking with a WIDENED DRIVEWAY that fits 2 cars across, plus extra space out front, rare in the area. Recent updates include, NEW FLOORING throughout most of the home, front door key pad, updated baths (all new toilets, sinks and faucets + more) and electrical (fixtures, lots and lots of POT LIGHTS, outlets, and switches). Energy-efficient improvements include 5 NEW WINDOWS, NEW PATIO DOOR, NEW AC (2024), a new thermostat, and a RE-INSULATED attic for year-round comfort. This home is both cozy & functional - with a wood-burning fireplace, fully finished family room, SEPARATE DINING ROOM and large bedrooms. Outdoor space includes a fruit producing pear tree, spacious front porch, new front eavestrough and a double deck out back. This prime location is nestled in a quiet community near parks, schools, and amenities, offering convenience and tranquility. Move-in ready with thoughtful upgrades throughout! Don't miss out on this fantastic opportunity... Welcome home!
Fridge, Stove, Dishwasher, Hood Fan
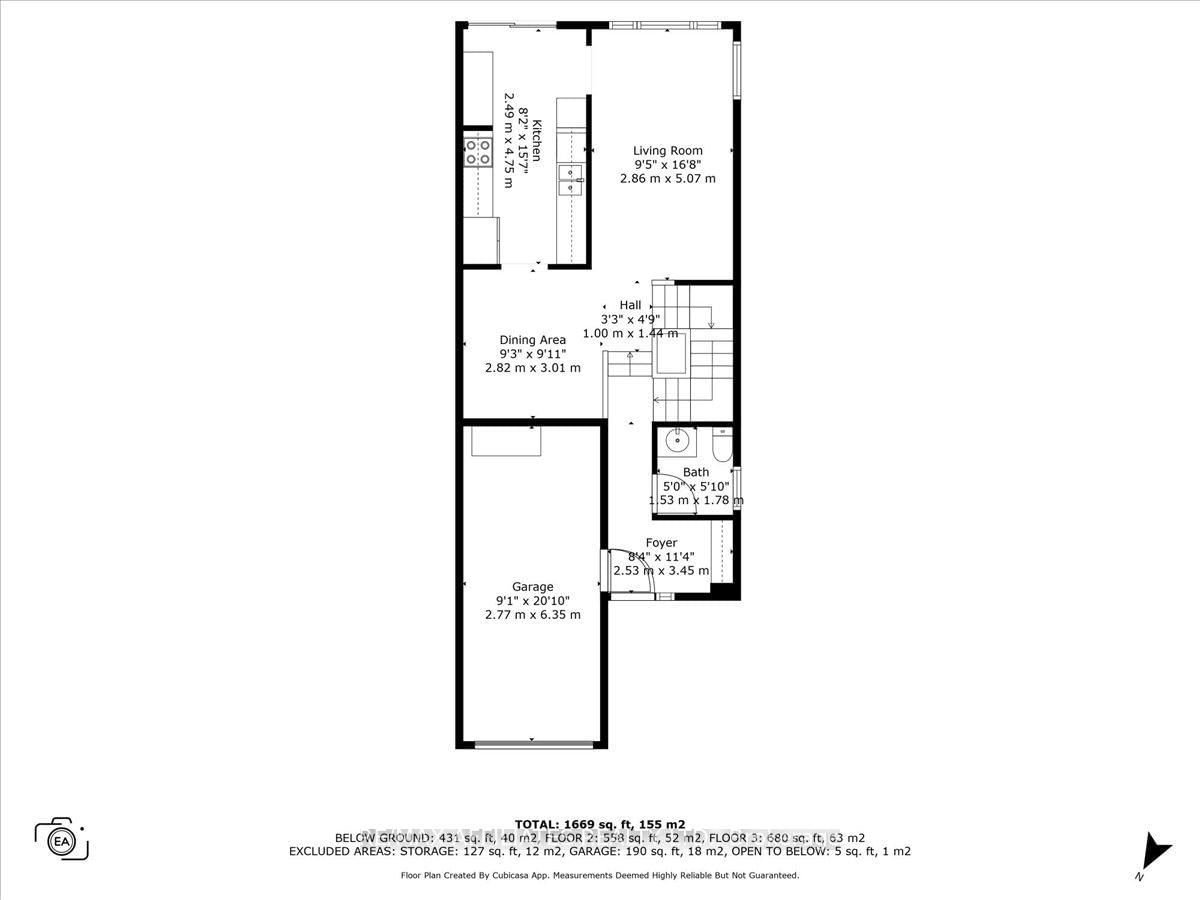
Foyer
Bathroom
Dining
Living
Kitchen
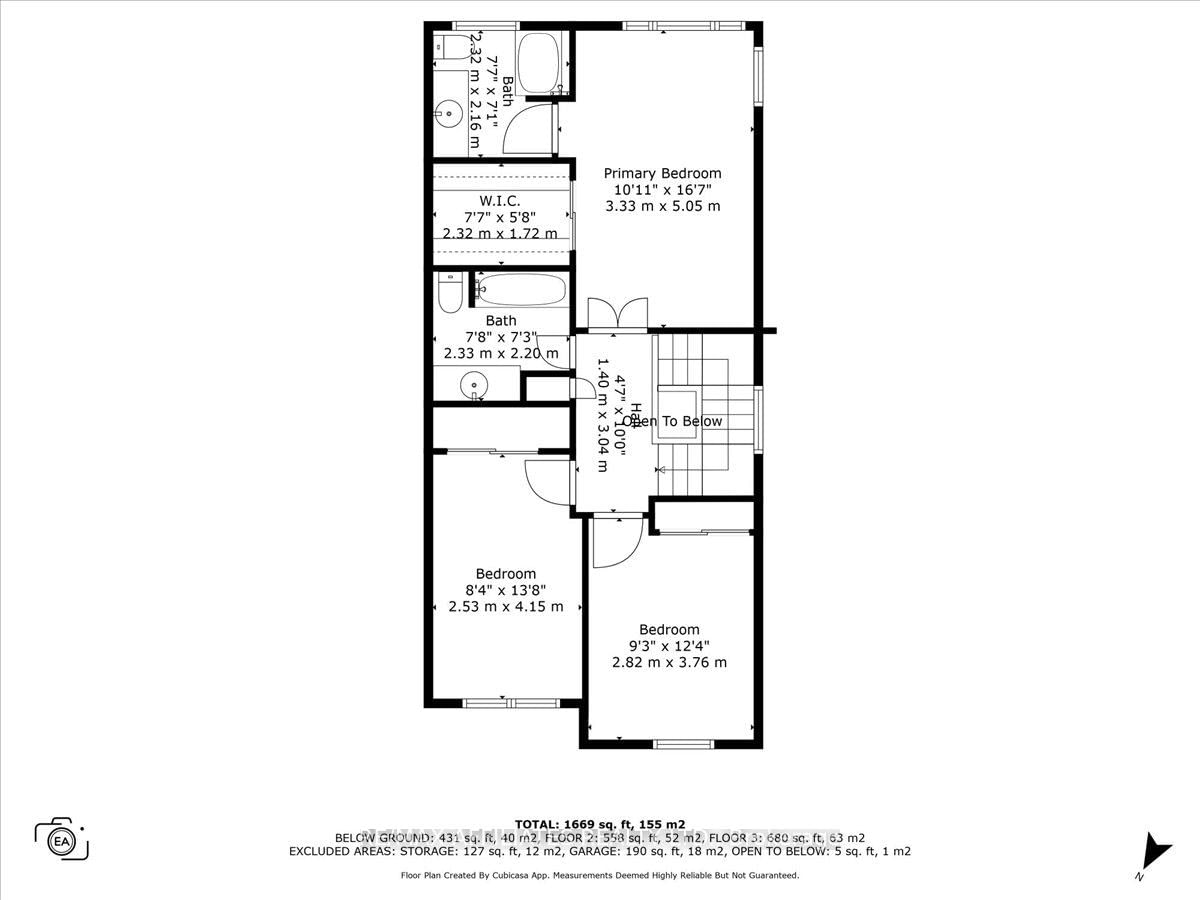
Primary
Bathroom
Other
2nd Br
3rd Br
Bathroom
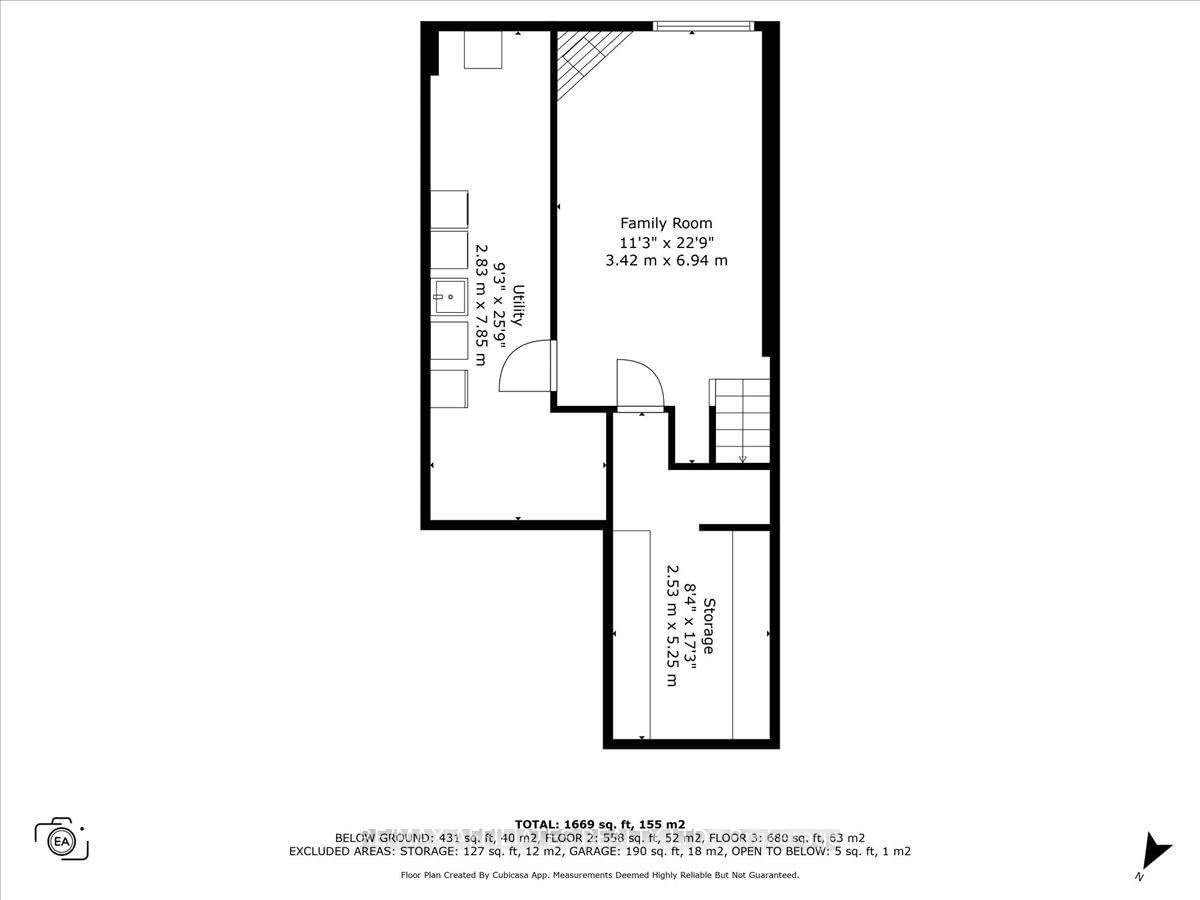
Family
Other
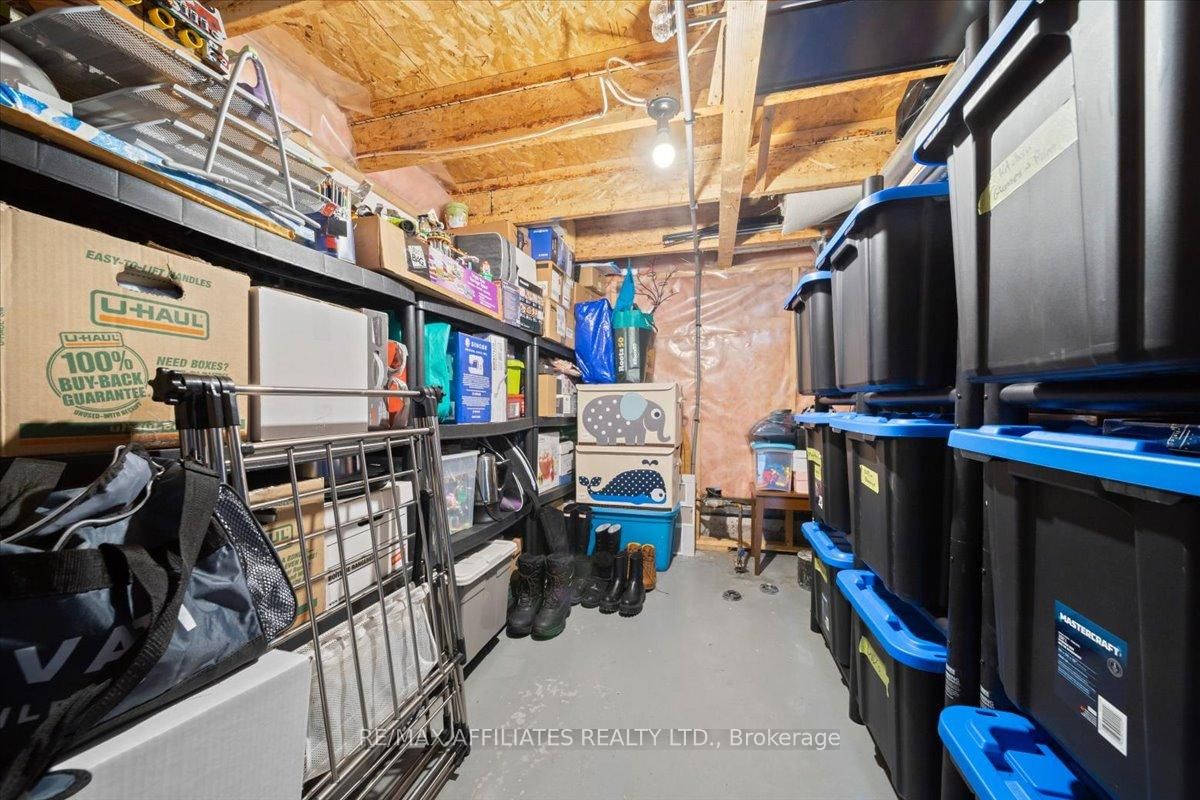
Laundry
The graph below compares the average list price and average sale price of homes in this neighborhood by month for the last 24 months. When average sale price is greater than average list price, this may suggest a buyer's market. When average sale price is lower than the average list price this may suggest a seller's market.
The graph below illustrates the average days on market for homes in this neighborhood. The yellow area may indicate a buyer's market, the green area may indicate a balanced market and the red area may indicate a seller's market.
Sales Representative, Century 21 People’s Choice Realty Inc., Brokerage
(647) 576 - 2100
Ottawa, Mer Bleue/Bradley Estates/Anderson Park, K1W 0B7
Ottawa, Mer Bleue/Bradley Estates/Anderson Park, K1W 0A9
Ottawa, Mer Bleue/Bradley Estates/Anderson Park, K1W 0H1
Ottawa, Mer Bleue/Bradley Estates/Anderson Park, K1W 0R2
Ottawa, Mer Bleue/Bradley Estates/Anderson Park, K1W 0N8